
Underwriting & Risk Management | June 29, 2026
EBITDA Adjustments & Normalization: How Credit Underwriters Build a Defensible Earnings Base
When a borrower hands you a CIM showing $10M in Adjusted EBITDA, the underwriting clock starts ticking. Before you size a loan, set a leverage covenant, or model a downside case, the most important question in the room is deceptively simple: how much of this EBITDA is real, repeatable, and financeable? The answer to that question determines debt capacity, covenant headroom, and ultimately whether your credit performs or restructures.
The Underwriting Challenge: Why EBITDA Is a Starting Point, Not a Conclusion
EBITDA is the lingua franca of credit underwriting, but it is not a GAAP-defined performance measure, which is precisely why it demands the most rigorous scrutiny in any deal process. Sellers and sponsors routinely present Adjusted EBITDA figures that include a long list of add-backs: one-time charges, owner compensation adjustments, non-recurring legal fees, and forward-looking synergies. Each of those add-backs carries a direct valuation consequence. At a 6.0x multiple, a single $500,000 unsupported add-back translates into $3 million of inflated enterprise value, and a proportionally over-leveraged capital structure from day one.
The problem is systemic. Academic research published by the University of Houston’s Bauer College of Business found that greater use of non-GAAP EBITDA add-backs materially increases the likelihood of loan delinquency and default, and also increases the likelihood of the borrower experiencing a credit rating downgrade. The credit market is also delivering its verdict in real time: Moody’s data shows that leveraged loan default rates are running nearly double their 3.4% historical average, with the loan market exhibiting the most distress particularly among borrowers with loan-only capital structures backed by private equity firms. Many of those stressed credits were underwritten to earnings bases that did not survive a single business cycle.
For the credit professional, this environment demands one discipline above all: the ability to reconstruct a clean, lender-underwritable earnings base from the ground up, independent of whatever the borrower has presented.
The Analytical Framework: The EBITDA Normalization Bridge
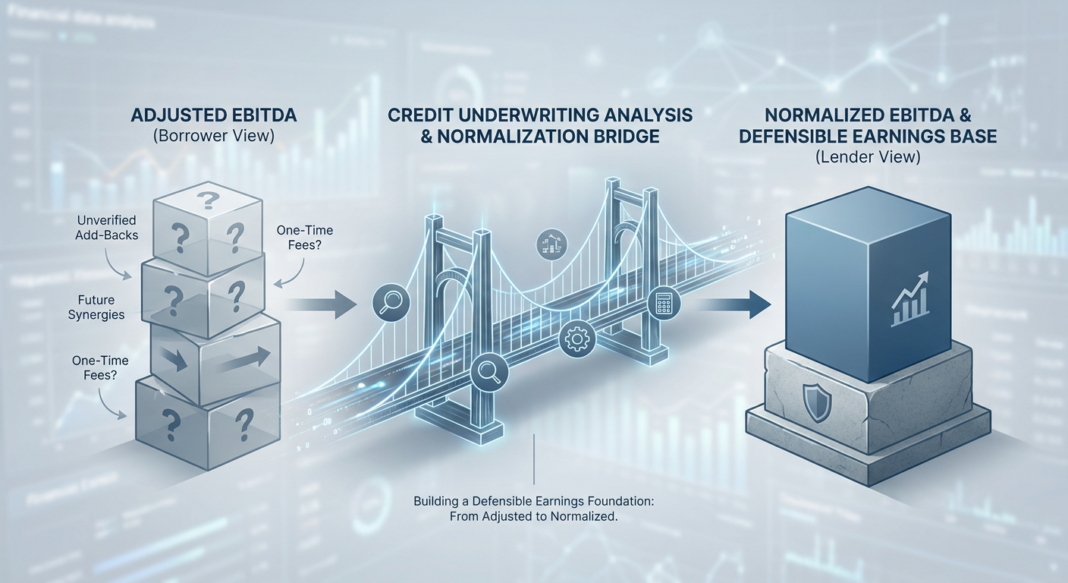
The normalization bridge is the structural core of any credit underwriting. It begins with reported EBITDA and arrives at Normalized EBITDA, defined as a defensible estimate of sustainable, recurring operating earnings that a lender can reliably underwrite. This is a materially different standard from the seller’s Adjusted EBITDA, which typically represents management’s initial pass at add-backs, often optimistic and only partially supported.
The bridge operates in four stages:
- Start with Reported (GAAP) EBITDA. Anchor to the audited income statement. Confirm the arithmetic and reconcile to cash flow statements to identify any disconnect between reported earnings and actual cash generation.
- Apply Upward Normalizations (Add-Backs). Remove items that are genuinely non-recurring and non-operating: one-time legal settlements, transaction advisory fees, severance from a restructuring event, or COVID-era revenue disruptions with documented support.
- Apply Downward Normalizations (Add-Downs). This is where most underwriters leave money on the table. If the owner-operator is compensated below market rate, the cost to replace that person must be added as an expense, reducing EBITDA. If the company benefits from below-market related-party rent, normalize to fair market. If stock-based compensation was added back, consider whether it represents a real ongoing economic cost.
- Independently Stress-Test Each Add-Back. Every adjustment must clear four tests: (i) Is it historical and fact-based, not forward-looking? (ii) Is it outside management’s recurring control? (iii) Is it supported by documentary evidence: invoices, legal filings, board resolutions? (iv) Will a lender’s own Quality of Earnings team give it full credit?
Example: Analyzing a $10M Adjusted EBITDA Manufacturing Business
| Line Item | Amount | Lender Verdict |
|---|---|---|
| Reported GAAP EBITDA | $7,800,000 | Anchored to audit |
| + One-time legal settlement | $400,000 | ✅ Accepted, documented filing |
| + Transaction advisory fees | $350,000 | ✅ Accepted, standard add-back |
| + Owner’s personal auto/travel | $180,000 | ✅ Accepted, personal expenses confirmed |
| + “Synergy savings” from planned RIF | $700,000 | ❌ Rejected, forward-looking, no execution |
| + Pro forma revenue from new contract | $600,000 | ❌ Rejected, no trailing performance history |
| − Market-rate CEO replacement cost | ($250,000) | 🔻 Add-down applied, owner underpaid |
| Lender-Underwritten Normalized EBITDA | $8,480,000 | vs. Borrower’s $10,030,000 |
The gap: $1,550,000. At a 5.5x leverage multiple, that gap represents over $8.5 million of structural debt overhang that the lender would be exposed to if it accepted the borrower’s EBITDA without scrutiny. That is the real cost of undisciplined normalization.
The Analysis: From Normalized EBITDA to Credit Metrics
Once a lender-underwritten Normalized EBITDA is established, the core credit metrics cascade directly from it. Here is how the analysis flows using the manufacturing example above:
Leverage Ratio (Net Debt / Normalized EBITDA)
If the proposed debt package is $46M on a borrower’s $10M Adjusted EBITDA, that implies a 4.6x leverage multiple on the sponsor’s numbers. On lender-underwritten Normalized EBITDA of $8.48M, actual leverage is 5.4x: materially different, and at the boundary of what most institutional private credit lenders will underwrite. Research on current market conditions indicates that most transactions are clearing at around 5.0x leverage for businesses with real earnings, strong cash conversion, and clean reporting, with premium assets at 6.0x being the exception.
Debt Service Coverage Ratio (DSCR)
DSCR is calculated as Normalized EBITDA minus unfinanced capex and cash taxes, divided by total debt service (principal + interest). Using lender-underwritten EBITDA of $8.48M, less $900K maintenance capex and $600K in cash taxes, yields cash available for debt service of $6.98M. Against annual debt service of $5.2M (interest + amortization), DSCR = 1.34x. This is below the 1.5x threshold that many institutional lenders use as a floor. Importantly, if EBITDA normalization is overly aggressive, DSCR may appear acceptable on paper but will fail during lender underwriting, one of the most common reasons deal processes stall or collapse entirely.
Downside Scenario / Stress Test
Apply a 15% EBITDA haircut (representing a moderate revenue contraction or margin compression): Stressed EBITDA = $7.21M. Stressed DSCR falls to 1.13x: dangerously close to covenant breach territory. This is not a tail scenario; it is standard underwriting practice to model a 15–20% EBITDA stress on middle-market manufacturing credits given their exposure to input cost volatility, customer concentration, and cyclical demand.
Industry Standards & Credit Performance Data
Understanding why EBITDA normalization discipline is non-negotiable requires grounding in current credit market data. The numbers tell a clear story about what happens when earnings bases are not rigorously underwritten.
📊 Credit Performance Data Box
- Private Credit Default Rate (2025): Moody’s analysis indicates the private credit default rate in 2025 likely ranged between 1.6% and 4.7%, depending on whether distressed exchanges are included, a wide band that reflects the opacity of earnings quality across the asset class.
- Distressed Exchange Dominance: Moody’s Ratings data shows that in 2025, roughly 65% of all corporate defaults were distressed restructurings (workouts, indenture modifications, and debt-for-equity swaps) rather than hard payment defaults. This reflects borrowers with structurally inflated earnings bases being given repeated extensions.
- Leveraged Loan Default Rate: For leveraged loan issuers, default rates are running nearly double the 3.4% historical average. Moody’s projected the leveraged loan default rate to end 2025 at 7.5%, with the loan market showing the most distress among borrowers with loan-only capital structures, precisely those where EBITDA add-backs are hardest to verify.
- First-Lien Recovery Rates: Moody’s has estimated expected ultimate recoveries on U.S. first-lien loans at roughly 68%, down from the long-run historical experience in the high-70s. For base-case modeling, 60–70% on first-lien collateral is considered a defensible current assumption; rating agencies use 45–60% in AAA stress scenarios.
- The Add-Back Gap in Practice: Buyers challenging add-backs during diligence frequently find a 20% to 40% discrepancy between a seller’s initial marketing EBITDA and the sustainable earnings verified through due diligence. Accepting a seller’s schedule without independent verification is not a negotiating position; it is an uninformed underwriting decision.
Sources: Moody’s Credit Strategy US Credit Review & Outlook (July 2025); Moody’s Default & Recovery Database; Ferdinand Investment Partners (2025); collateralizedloanobligations.com Recovery Rate Database.
What Institutional Lenders Look For
Experienced direct lenders underwrite with a critical lens on three dimensions of EBITDA quality. First, they evaluate margin sustainability: does gross margin show consistent patterns over 3–5 years, or are recent improvements driven by one-time pricing power or cost cuts unlikely to persist? Second, they assess revenue quality: a Quality of Earnings review evaluates revenue recognition, customer concentration, revenue quality, gross margin trends, add-back support, and the relationship between EBITDA and actual cash flow. Third, they demand cash conversion coherence: if Normalized EBITDA is $8.5M but the company has generated only $4M in cumulative free cash flow over three years, the gap requires an explanation, and that explanation must be verifiable.
Red flags that trigger immediate underwriting skepticism include: forward-looking cost synergies presented as already-achieved savings; stock-based compensation add-backs on businesses where equity compensation is a structural retention tool; revenue from contracts signed-but-not-started; and any add-back that removes an expense while retaining the revenue that expense was generating, what practitioners call a one-sided margin improvement. One-sided adjustments that improve the margin profile without acknowledging the cost of sustaining the underlying revenue are among the most technically aggressive presentations in a normalization bridge.
Underwriting Checklist: EBITDA Normalization Due Diligence
The following is a practitioner’s step-by-step framework for building a lender-underwritten EBITDA from scratch:
Phase 1: Document Collection & Anchoring
- ☐ Obtain 3–5 years of audited financial statements (or reviewed financials at minimum for middle-market borrowers)
- ☐ Request LTM (last twelve months) management accounts with month-by-month P&L detail
- ☐ Reconcile management-reported EBITDA to GAAP net income with a formal bridge
- ☐ Map all cash flow statements to identify working capital movements and non-cash items
Phase 2: Add-Back Challenge & Verification
- ☐ Request a complete add-back schedule with documentary support for every item (invoices, legal filings, board minutes)
- ☐ Test each add-back against four criteria: historical vs. forward-looking; within or outside management control; documentable; and lender-creditable in financing discussions
- ☐ Specifically challenge any add-back exceeding 5% of reported EBITDA; these require the highest documentary bar
- ☐ Scrutinize stock-based compensation, management fees, and related-party transactions for arm’s-length pricing
- ☐ Ask: would this adjustment survive a Quality of Earnings review conducted by a Big 4 or reputable advisory firm?
Phase 3: Add-Down Analysis
- ☐ Benchmark owner/management compensation to market replacement cost for equivalent roles
- ☐ Adjust rent, management fees, or intercompany services to arm’s-length market rates
- ☐ Identify and cost any key-person dependency: if critical revenue is owner-driven, model the cost of replacing that relationship
- ☐ Assess whether reported margins reflect unsustainable cost discipline (e.g., deferred maintenance, underfunded marketing)
Phase 4: Credit Metric Derivation & Covenant Calibration
- ☐ Derive Leverage Ratio, DSCR, and Interest Coverage from lender-underwritten Normalized EBITDA only, never from the borrower’s Adjusted EBITDA without independent verification
- ☐ Stress-test at a minimum 15–20% EBITDA haircut and confirm covenant headroom survives
- ☐ Set financial maintenance covenants with deliberate headroom relative to projections, covenants set too loosely may allow a borrower to exhaust liquidity well before triggering any lender intervention right
- ☐ Confirm that the Debt/EBITDA definition in the credit agreement uses the lender-negotiated EBITDA construct, not a looser borrower definition with uncapped add-backs
- ☐ Document all normalization work in the credit approval memorandum with explicit notation of rejected add-backs and rationale
Key Takeaways
- 🔑 Normalized EBITDA ≠ Adjusted EBITDA. The borrower’s Adjusted EBITDA is the starting point of your analysis, not the conclusion. A lender-underwritten Normalized EBITDA reflects only adjustments that are historical, documented, outside recurring management control, and independently verifiable.
- 🔑 Every rejected add-back has a structural consequence. At a 5.5x leverage multiple, a $1M reduction in the accepted EBITDA base translates directly into $5.5M of excess leverage that the credit was not sized to absorb, reducing both covenant headroom and recovery value in a downside scenario.
- 🔑 Add-downs matter as much as add-backs. A credible normalization bridge includes both upward and downward adjustments. Underwriters who only look for add-backs to validate consistently miss the structural costs embedded in owner-managed businesses that will crystallize under new ownership.
- 🔑 The credit data supports EBITDA discipline. With leveraged loan default rates running nearly double their historical average and distressed restructurings comprising approximately 65% of all 2025 corporate default events, the evidence base for rigorous EBITDA normalization has never been stronger, or more urgent.
- 🔑 Covenant construction must follow the earnings base. Financial maintenance covenants (leverage ratios, DSCR thresholds, interest coverage floors) must be calibrated to lender-underwritten Normalized EBITDA, not the borrower’s optimistic Adjusted EBITDA. Covenants calibrated to inflated earnings bases provide no early warning; by the time they breach, the credit has often already deteriorated beyond recovery.


