
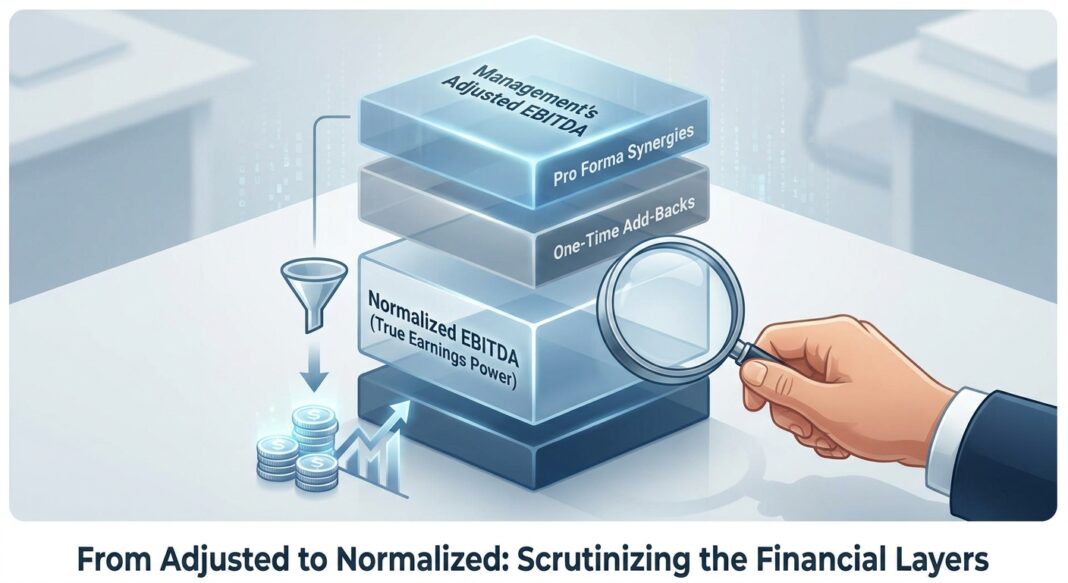
The Underwriting Challenge: Whose EBITDA Are You Actually Lending Against?
Every middle-market credit submission arrives with a management-prepared EBITDA figure. It is almost never the number a rigorous lender should use. Between the income statement and the credit committee lies a critical analytical discipline, EBITDA normalization, that separates lenders who underwrite sustainable earnings from those who finance a sponsor’s most optimistic storytelling.
The gap between reported EBITDA and the adjusted figure management presents can be material. According to the Financial Stability Board’s May 2026 report on vulnerabilities in private credit, the use of EBITDA adjustments across private credit is pervasive enough that “true” leverage in private credit portfolios could be closer to 7x debt-to-EBITDA when adjustments are stripped back, materially higher than headline reported figures suggest. That delta between adjusted and normalized EBITDA is not semantic. It is the difference between a credit that services its debt and one that breaches covenants at the first sign of operational stress.
The underwriting question every direct lender must answer before committing capital is precise: Which version of EBITDA is financeable, and at what multiple?
The Analytical Framework: A Four-Layer Normalization Hierarchy
A disciplined lender does not accept a single adjusted EBITDA figure. Instead, the normalization process is structured as a hierarchy of increasingly rigorous scrutiny, moving from the borrower’s presentation to the lender’s independently constructed earnings baseline.
Layer 1: Reported EBITDA (The Starting Point)
Reported EBITDA is derived directly from the income statement: Net Income + Interest + Taxes + Depreciation + Amortization. This is the raw figure. As noted by Sofer Advisors, EBITDA is the starting point, not the endpoint: the raw figure from the income statement includes owner compensation at its current level, one-time expenses, and non-cash charges that will not recur under new ownership. A lender who underwrites against this figure without adjustment is not underwriting at all.
Layer 2: Management’s Adjusted EBITDA (The Seller’s Narrative)
Management and their advisors will present an adjusted figure that adds back items they characterize as non-recurring, one-time, or owner-specific. As Mowery & Schoenfeld observes, sellers often present adjusted EBITDA in a way that highlights business strengths and makes it look as appealing as possible, sellers are looking for a “marketable” earnings number. The lender’s job is to challenge every line item in this bridge.
Common management add-backs that require scrutiny include:
- Non-recurring professional fees (legal disputes, one-time consulting): Verify these are genuinely non-repeating. Ask for three years of history, if similar fees appear annually, they are a recurring cost of doing business.
- Excess owner compensation: Add back the portion above market-rate replacement salary. This requires a defensible benchmarking analysis, not a sponsor’s estimate.
- COVID or macro disruption adjustments: Post-2022, these are largely indefensible. Lenders should apply significant skepticism to any pandemic-era add-backs still appearing in 2025–2026 submissions.
- Stock-based compensation: Non-cash but a real economic cost if talent retention depends on equity grants. Lenders should evaluate the true cash replacement cost.
- Pro forma synergies and cost savings: The most dangerous category. These represent future earnings that have not yet been realized.
Layer 3: Normalized EBITDA (The Lender’s Independent Baseline)
Auxo Capital Advisors defines normalized EBITDA as a buyer-underwritable estimate of sustainable, recurring operating earnings; it starts with reported EBITDA, removes non-recurring items, and adjusts for supportable run-rate effects. Critically, the lender’s normalization exercise is more conservative than the management version. Lenders should only consider adjustments that can be clearly justified and traced back to the company’s financial statements, as Mowery & Schoenfeld notes, because the EBITDA definition drives debt sizing, covenants, and repayment capacity.
Layer 4: Quality of Earnings (QoE) Validated EBITDA
The QoE process, conducted by an independent accounting firm, is the highest-confidence earnings figure available at underwriting. According to Auxo Capital Advisors, a QoE review commonly evaluates revenue recognition, customer concentration, revenue quality, gross margin trends, add-back support, reserves, accounting cutoffs, working-capital behavior, cash conversion, and the relationship between EBITDA and cash flow. The purpose is not just to verify arithmetic; it is to determine whether the earnings base used in valuation is accurate, repeatable, and financeable.
Rule of thumb: If no independent QoE report exists, the lender must apply a conservatism discount of at least 10–15% to management’s adjusted EBITDA before sizing debt.
Walking Through the Calculations: A $10M EBITDA Manufacturing Company
Consider a sponsor-backed acquisition of a specialty parts manufacturer. The CIM presents the following earnings bridge:
| Line Item | Amount | Lender Assessment |
|---|---|---|
| Reported EBITDA | $7.2M | Starting point, no controversy |
| Add: One-time legal settlement | +$0.6M | ✓ Accept, documented, non-recurring |
| Add: Excess owner salary above market | +$0.4M | ✓ Accept (partial), reduce to $0.25M after benchmarking |
| Add: Pro forma cost savings (unearned) | +$1.2M | ✗ Reject, no operational history to support |
| Add: “One-time” IT implementation costs | +$0.3M | ✗ Reject, recurring systems spend flagged in prior 3 years |
| Add: Stock-based compensation | +$0.3M | ⚠ Partial, include 50%; rest is real retention cost |
| Management Adjusted EBITDA | $10.0M | Sponsor’s headline number |
| Lender Normalized EBITDA | $8.1M | After rejecting $1.5M in unsupported add-backs + partial SBC |
The consequence of this normalization exercise is significant. If the sponsor structures the acquisition at 5.0x management EBITDA, the resulting $50M debt load implies 6.2x normalized leverage, not 5.0x. The difference between those two leverage ratios determines whether the company can service its debt under a moderate stress scenario. As Auxo Capital Advisors underscores, the debate over normalization affects not only valuation multiples, but the bridge from net debt to final credit structure.
Stress-Testing the Normalized Figure
Once a defensible normalized EBITDA is established, the lender must then stress it. Applying a 15% revenue decline with 200 bps margin compression to the $8.1M normalized base yields approximately $6.0M downside EBITDA, producing a leverage ratio of 8.3x against the $50M debt structure. A minimum DSCR of 1.25x in the downside case, the institutional floor per Bond Capital’s stress testing framework, would require at minimum $4.8M of EBITDA after interest and mandatory amortization. At $6.0M downside EBITDA against $3.5M in annual debt service, the credit barely threads the needle. This is where EBITDA normalization discipline directly determines recovery outcomes.
Industry Standards: What Institutional Lenders Require
The private credit market’s increasing scrutiny of EBITDA adjustments reflects both market maturation and hard lessons from the 2022–2024 rate cycle. Several institutional benchmarks now govern how rigorous lenders approach this problem:
The Add-Back Scrutiny Standard
PKF O’Connor Davies notes that buyers and lenders increasingly want to understand how EBITDA translates to free cash flow and how recurring and predictable that conversion is; they are looking for a clear coherent narrative, scenario-tested cash flow models, and substantiation aligned with business reality. For complex pro forma adjustments, buyers expect not only robust supporting evidence but a demonstrated history of successful execution of similar cost-reduction initiatives.
The practical standard most experienced direct lenders apply: if the gap between reported EBITDA and management’s adjusted EBITDA exceeds 20–25% of reported, the entire add-back schedule requires independent QoE validation before the credit committee will approve a commitment.
Leverage Calibrated to Lender-Normalized EBITDA
As detailed in Bond Capital’s covenant framework, most middle-market first-lien facilities covenant at 5.5x–6.0x leverage, but this ratio is meaningless if the denominator is an inflated EBITDA figure. Experienced credit teams calibrate their leverage covenants against a conservatively normalized EBITDA that can survive independent scrutiny, not management’s optimistic version. The FSB’s May 2026 report found that previous research in the leveraged loan market showed most EBITDA adjustments did not materialize, underscoring that lenders who accept unearned add-backs systematically underprice credit risk.
📊 Credit Performance Data Points
- Middle-market default rate (Q3 2025): KBRA recorded a rate of 3.5% by borrower count and 2.1% of the roughly $1 trillion in notional debt outstanding, with expectations of a modest rise in 2026 as borrower fundamentals deteriorate.
- Leverage at maturity walls: Nearly 30% of companies with debt maturing before end of 2026 carry leverage above 10x or report negative EBITDA, a direct consequence of inflated add-backs accepted at origination.
- Moody’s speculative-grade default forecast: Moody’s forecasts US speculative-grade defaults at 3.0% by October 2026, though covenant-lite issuance is rising and reducing lender protections, lowering recovery rates on defaults.
- FSB on true leverage: The FSB’s May 2026 vulnerability report found that with adjustments stripped back, the typical “true” leverage in private credit could be closer to 7x debt-to-EBITDA, a significant divergence from headline numbers.
- Recovery rates under covenant-lite structures: Per Moody’s, while fewer defaults suggest stronger CLO performance, covenant-lite structures erode recoveries and increase loss severity in stress scenarios, a direct downstream consequence of weak upfront EBITDA normalization discipline.
Red Flags That Require Immediate Escalation
- Recurring “one-time” items: If similar add-backs appear in each of the trailing three years, they are not one-time. Period.
- EBITDA diverging from cash flow: As Mowery & Schoenfeld emphasizes, if EBITDA increases but the company is not generating more cash from regular operations, improved earnings may be on paper only, from accounting changes or timing differences, not real growth.
- Unsupported synergy add-backs: Pro forma cost savings without a demonstrated execution track record are the single highest-risk category in a CIM earnings bridge.
- Affiliated-party transactions at non-market rates: Below-market rent from related landlords or above-market service fees from sponsor portfolio companies both distort reported earnings and must be normalized to arm’s-length terms.
- PIK income or deferred revenue inflating EBITDA: The FSB notes that PIK arrangements are positively correlated with borrower stress. Any EBITDA figure that includes accrued-but-uncollected income requires careful scrutiny of actual cash conversion.
The EBITDA Normalization Underwriting Checklist
Before any credit committee presentation, a rigorous lender should complete the following diligence steps on every EBITDA normalization exercise:
- Obtain three years of audited or reviewed financials. Single-year LTM EBITDA is insufficient. Trend analysis across at least three fiscal years is required to distinguish cyclical performance from structural earnings power.
- Reconstruct the reported EBITDA independently. Tie every line item in management’s adjusted EBITDA bridge back to the underlying financial statements. Do not accept a CIM bridge without full documentation support.
- Map every add-back to a specific, verifiable event. Require contemporaneous documentation (invoices, legal agreements, board resolutions) for each claimed non-recurring item. If documentation does not exist, reject the add-back.
- Apply the “recurrence test.” For each add-back category, verify the trailing three-year history. Any item appearing in more than one of the three years should be treated as a recurring operating cost.
- Normalize owner compensation to market benchmarks. Use BLS Occupational Wage Statistics, industry compensation surveys, or direct comparables. Document the benchmark source in the credit file.
- Reject all pro forma synergies without operational history. Synergy add-backs are permissible only when: (a) the cost reduction has already been implemented, (b) the savings are reflected in trailing financials, and (c) the QoE provider has independently validated the run-rate amount.
- Reconcile EBITDA to free cash flow. Calculate working capital intensity, maintenance capex requirements, and cash taxes. A business with $8M normalized EBITDA but $3M in required maintenance capex and $1.5M in cash taxes has $3.5M of true free cash flow, not $8M.
- Require an independent QoE report for all transactions above $10M. Where no QoE exists, apply a conservatism haircut of 10–15% to management’s adjusted EBITDA before calculating leverage ratios.
- Ask the final question: Would the lender still approve this credit at management’s EBITDA minus 20%? If the answer is no, the structure requires re-sizing, not re-modeling.
Key Takeaways
- Management EBITDA is a starting point, never a conclusion. The lender’s independent normalization exercise (rejecting unsupported add-backs, benchmarking owner costs, and reconciling to cash flow) is the most consequential analytical step in middle-market credit underwriting.
- The add-back gap is systemic and material. The FSB’s 2026 data indicates that true private credit leverage may be approximately 7x when adjustments are unwound, versus headline figures that routinely show 5.0x–5.5x. Lenders who accept inflated EBITDA are accepting hidden leverage.
- Pro forma synergies are the highest-risk add-back category. They represent earnings that have not been earned. Absent a documented operational track record, they should be excluded from the lender’s underwriting EBITDA in every case.
- EBITDA must reconcile to free cash flow. Working capital intensity, maintenance capex, and cash taxes can consume 30–50% of EBITDA in capital-intensive middle-market businesses. The debt service coverage ratio must be calculated against levered free cash flow, not raw EBITDA.
- Normalization discipline directly protects recovery outcomes. With nearly 30% of middle-market borrowers approaching maturity walls carrying leverage above 10x, the downstream consequence of inflated origination EBITDA, lenders who normalize rigorously at underwriting are the same lenders who recover principal when those maturities arrive.


