
The Underwriting Challenge: When the EBITDA Number Isn’t the Business
A sponsor-backed borrower presents a Confidential Information Memorandum showing $12 million in Adjusted EBITDA for a precision manufacturing business. The debt package proposed is $60 million, a clean-looking 5.0x leverage. The QoE report, prepared by the sponsor’s own accounting firm, supports the number. So does the management presentation.
Now the underwriting begins in earnest.
Inside that $12 million EBITDA are $2.1 million in add-backs: $800K in one-time legal fees (described as non-recurring), $600K in integration costs from an acquisition completed 18 months ago, $400K in management consulting fees the new owner says won’t continue, and $300K in projected cost savings from a headcount restructuring that hasn’t happened yet. Strip out the items that don’t pass a lender’s standard of evidence, and true run-rate EBITDA is closer to $9.8 million. At $60 million in debt, that’s not 5.0x leverage, it’s 6.1x. And the interest coverage ratio, which looked comfortable at 2.2x, drops below 1.8x.
This scenario plays out across middle-market deal flow every week. The ability to independently reconstruct a borrower’s EBITDA, not accept the sponsor’s version, is the single most important analytical discipline in private credit underwriting. This article provides the framework to do it rigorously.
The Framework: Normalization vs. Adjustment, Why the Distinction Is Critical
The terms are often used interchangeably, but they are not the same thing, and a lender who conflates them takes on materially more risk than they price for.
Normalized EBITDA reflects what the business actually earned on a representative historical basis: after removing non-recurring, non-operating, unusual, or owner-specific items so the business can be valued and underwritten on a sustainable earnings foundation. It is a backward-looking, evidence-anchored number.
Adjusted EBITDA, as used in private equity underwriting contexts, can layer in additional forward-looking assumptions: projected cost synergies, anticipated headcount reductions, pro forma revenue from recently acquired entities, and run-rate savings from initiatives not yet implemented. These are not representations of historical performance; they are investment theses embedded inside an earnings figure.
Lenders must separate these two categories with precision. As one 2026 analysis of M&A diligence practice notes, sellers and their advisors have “expanded its scope to include future savings not yet made, operational improvements not yet implemented, and revenue assumptions that have not materialized.” When a seller’s EBITDA schedule blends historical normalization with forward-looking pro forma items, the two must be segregated and evaluated independently, because the price is set on history, and upside belongs in the equity return model, not the debt capacity calculation.
Lenders are generally conservative for a structural reason: EBITDA drives debt sizing, covenant thresholds, and repayment capacity simultaneously. An inflated EBITDA that lenders do not independently verify creates leverage structures that are fundamentally higher-risk than their documentation suggests, and in today’s market, that risk is systemic, not idiosyncratic.
The Five Categories of EBITDA Add-Backs a Lender Must Evaluate
- Non-Cash Charges: Stock-based compensation, impairment charges, amortization of intangibles, generally accepted with documentation.
- Non-Recurring / One-Time Items: Legal settlements, transaction fees, restructuring charges, subject to scrutiny on whether they are truly non-recurring.
- Owner-Specific / Discretionary Items: Above-market compensation, personal expenses run through the business, founder-specific perquisites, should be normalized to market-rate replacements, not eliminated entirely.
- Pro Forma Synergies and Cost Savings: The highest-risk category. Lenders must require evidence of completed actions, not planned ones. A forward-looking period should be time-limited, typically 12–18 months.
- Pro Forma Acquisition Adjustments: Revenue and EBITDA from recently acquired entities as if held for a full period, permissible but must be stress-tested against integration risk and actual acquired EBITDA, not projected performance.
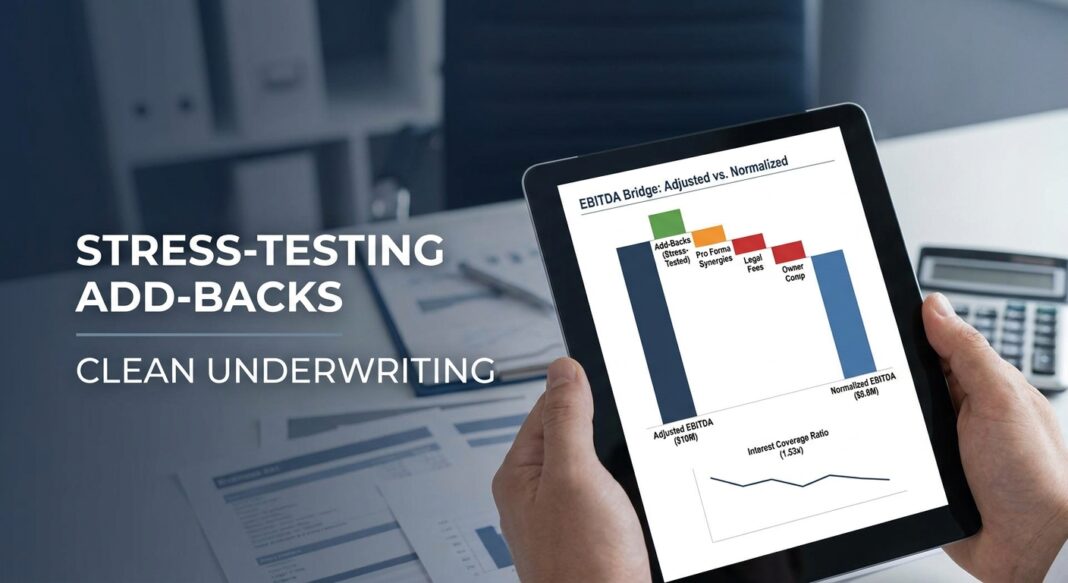
The Analysis: Walking Through a $10M EBITDA Manufacturing Company
Consider a middle-market industrial services company presenting the following EBITDA bridge in its CIM:
| Item | Amount ($000s) | Lender Assessment |
|---|---|---|
| Reported GAAP Net Income | $2,200 | Starting point |
| + Interest, Taxes, D&A | $4,800 | Accepted, standard |
| = Base EBITDA | $7,000 | Baseline |
| + Stock-Based Compensation | $350 | Accepted, non-cash |
| + Legal Settlement (one-time) | $500 | Accepted with reservation: lender requests 3-year legal history to confirm non-recurrence |
| + Excess Owner Compensation | $400 | Partially accepted: lender normalizes to $250K market-rate replacement; $150K rejected |
| + Planned Cost Savings (headcount) | $750 | Rejected: restructuring not initiated; no evidence of completed action |
| + Pro Forma Acquisition EBITDA | $1,000 | Haircut to $700K: lender applies 30% integration discount pending first full quarter of combined results |
| Sponsor’s Adjusted EBITDA | $10,000 | Presented figure |
| Lender’s Underwritten EBITDA | $8,800 | After rejections and haircuts |
The debt sizing impact is material. At $50 million in proposed debt:
- Sponsor’s leverage: $50M ÷ $10M = 5.0x
- Lender’s underwritten leverage: $50M ÷ $8.8M = 5.68x
At an all-in interest rate of 11.5% (SOFR + spread), total annual interest is approximately $5.75 million.
- Sponsor ICR: $10M ÷ $5.75M = 1.74x
- Lender ICR: $8.8M ÷ $5.75M = 1.53x
The difference between 1.74x and 1.53x coverage sounds modest, until EBITDA contracts 15% in a cyclical downturn, bringing underwritten ICR below 1.3x and triggering covenant review. This is precisely why EBITDA normalization must be completed before, not after, term sheet negotiation.
Industry Standards, Benchmarks & What the Data Shows
Credit performance data from multiple institutional sources in 2025–2026 provides a clear risk backdrop for underwriters navigating the current market environment.
📊 Data Box: Private Credit Risk Benchmarks (2025–2026)
- Private credit default rate range (2025): 1.6%–4.7% depending on whether distressed exchanges are included, Moody’s Ratings analysis via Moody’s
- Distressed exchanges as share of all defaults (2025): ~65% (meaning most "defaults" are restructurings that defer, not resolve, underlying stress) Moody’s Ratings
- Leveraged loan default rate (2025): Projected to end the year at 7.5%, nearly double the 3.4% historical average, Moody’s US Credit Review & Outlook, July 2025
- Median interest coverage ratio (2024): 1.7x across surveilled private credit borrowers; 27% had ICR below 1.0x, FDIC Risk Review 2025
- Average middle-market leverage (2024): 7.0x across the broader U.S. middle-market credit estimate population, analysis via The ESK Analysis Series, 2025
- KBRA Direct Lending Index default rate: 1.8% trailing 12-month as of end of 2024; lower middle market forecast to reach 3% by year-end 2025, Valuation Research Corp., citing KBRA, 2025
- Non-accruals across major BDC platforms (Q3 2025): 0.9%, Heron Finance State of Private Credit Report, Q1 2026
What Institutional Lenders Look For, and What Triggers Rejection
Add-back caps are now standard practice. Because expansive add-backs can materially affect leverage outcomes, lenders commonly impose caps, often expressed as a percentage of EBITDA, on projection-based or non-recurring adjustments, along with time-based restrictions, to better reflect actual operating cash flows. A common structuring approach is to cap pro forma synergy and cost-savings add-backs at a fixed percentage of base EBITDA, typically in the range of 15–25%, with mandatory expiration after 12–18 months.
The covenant alignment problem. While the leverage ratio dominates private credit documentation, covenant design is most effective when aligned with the borrower’s underlying business model, a formulaic approach rarely produces durable results. For mature, predictable cash-flow businesses, EBITDA-based covenants set at maintenance levels (tested quarterly) remain the market standard. For more volatile, capital-intensive businesses, lenders should supplement leverage covenants with fixed charge coverage ratios that capture capex and scheduled amortization, not just interest.
The covenant-lite erosion risk. As private credit has migrated upmarket and competed directly with the broadly syndicated loan market for large unitranche deals, cov-lite and cov-loose structures have spread. A Proskauer survey identified EBITDA add-backs and covenant-lite structures as the top two risk concerns in direct lending. Broadly defined and heavily adjusted EBITDA has significantly diluted the effectiveness of maintenance covenants, creating a market where lenders have less early warning of borrower deterioration than their documentation implies.
The 2021-vintage stress cohort. Deals originated in 2021 at leverage above 6.0x on an adjusted EBITDA basis (which on a true cash-flow basis could represent 8.0x or higher) are facing the most acute stress as floating-rate obligations repriced in a higher-for-longer environment. This cohort exemplifies what happens when EBITDA normalization discipline breaks down at origination: the structural leverage at entry is permanently higher than the documentation records.
Underwriting Checklist: EBITDA Normalization Diligence Protocol
The following step-by-step protocol reflects the institutional standard for EBITDA normalization in private credit underwriting. Every item represents a question that must be answered, with documentation, before a credit committee should approve a term sheet.
Phase 1: Documentation Assembly
- Obtain 3 years of audited financial statements plus trailing twelve-month (TTM) management accounts.
- Request the seller’s or sponsor’s EBITDA bridge schedule with line-item descriptions and dollar amounts for every add-back.
- Obtain the Quality of Earnings (QoE) report prepared for the transaction, but note the preparer, its mandate, and whether it was prepared for the buyer, seller, or lender.
- Request general ledger support for all non-recurring items exceeding $100K.
- Collect three years of legal expense detail and litigation history to test the "one-time legal fee" classification.
Phase 2: Add-Back Stress Testing
- For each non-recurring add-back: Has this item appeared in more than one of the last three fiscal years? If yes, reclassify as recurring.
- For pro forma cost savings: Has the restructuring action been initiated (e.g., termination notices issued, facility closure begun)? If not, reject entirely.
- For acquisition EBITDA: Apply a minimum 25–30% integration haircut to acquired entity EBITDA until two full quarters of combined results are available.
- For owner compensation normalization: Replace actual owner draw with a market-rate salary for the equivalent role. Do not eliminate the cost entirely.
- Apply the lender’s aggregate add-back cap (e.g., 20% of base EBITDA). If total add-backs exceed the cap, reduce pro-rata or by priority of defensibility.
Phase 3: Metric Calculation and Covenant Anchoring
- Calculate underwritten leverage: Total Debt ÷ Lender’s Normalized EBITDA. Compare to sponsor’s stated multiple.
- Calculate interest coverage ratio: Normalized EBITDA ÷ Total Annual Cash Interest Expense. Minimum threshold: 1.75x for senior secured middle-market lending; flag anything below 2.0x for elevated monitoring.
- Calculate Fixed Charge Coverage Ratio (FCCR): (EBITDA – Unfinanced Capex) ÷ (Cash Interest + Scheduled Amortization). Minimum: 1.10x–1.20x.
- Set maintenance covenant levels at a minimum 15–20% cushion to underwritten levels, not sponsor model projections.
- Document the delta between sponsor’s Adjusted EBITDA and lender’s Normalized EBITDA. If the gap exceeds 15% of the proposed debt base, escalate to credit committee for additional review.
Key Diligence Questions to Ask
- What is the company’s track record on delivering projected cost savings in prior periods?
- Has EBITDA grown consistently with revenue, or is margin expansion driven primarily by add-backs?
- Does operating cash flow corroborate the EBITDA figure? A growing gap between reported EBITDA and operating cash flow is a structural red flag.
- Are integration costs from the same acquisition appearing across multiple periods?
- Has the company’s legal expense run rate increased year-over-year while legal items are simultaneously being added back as non-recurring?
Key Takeaways
- Reported EBITDA is a starting point, not a conclusion. The lender’s normalized EBITDA (reconstructed from audited financials with conservative, evidence-anchored add-back standards) is the only defensible basis for debt sizing and covenant setting.
- The normalization/adjustment distinction is structurally important. Historical normalization belongs in the lender’s underwriting model. Forward-looking pro forma assumptions belong in the sponsor’s equity return model, not in the debt capacity calculation.
- Add-back caps are a necessary structural control. Lenders should impose both individual caps and aggregate caps on non-recurring and projection-based adjustments, expressed as a percentage of base EBITDA, with time-limited applicability.
- The 2025–2026 credit environment rewards issuer-level diligence. With private credit default rates ranging between 1.6% and 4.7% depending on how distressed exchanges are counted, and 27% of surveilled borrowers carrying ICRs below 1.0x as recently as 2024, the market is not in a uniformly benign credit environment; it is fragmented, with concentrated stress in highly leveraged, floating-rate, covenant-loose structures.
- Covenant design must be anchored to underwritten EBITDA, not sponsor projections. Maintenance covenants set with insufficient headroom to underwritten normalized EBITDA provide no real early-warning function. A covenant that only trips when a business has already experienced severe deterioration does not protect lender capital; it merely documents failure after the fact.


