
Underwriting & Risk Management | June 24, 2026
EBITDA Adjustments and Normalization in Middle-Market Credit Underwriting
A Practitioner’s Framework for Sizing Defensible Debt
The Underwriting Challenge: Which EBITDA Are You Actually Lending Against?
A borrower walks in with a Confidential Information Memorandum showing $12 million of adjusted EBITDA. The sponsor has backed out a one-time legal settlement, normalized owner compensation, added forward synergies from an acquisition, and credited a planned cost reduction that has not yet been implemented. On paper, the credit looks clean at 4.5x leverage. On a lender-adjusted basis, it may be 6.2x.
This is the EBITDA normalization problem, and it sits at the center of every leveraged credit decision in the middle market today. Reported EBITDA is almost never the right number to underwrite. But the adjusted EBITDA management presents is often not the right number either. The lender’s job is to build a third number: a defensible, repeatable, cash-flow-supported earnings figure that reflects what the business will realistically generate across a credit cycle.
The stakes are high. Debt capacity, covenant thresholds, coverage ratios, and recovery assumptions all flow directly from EBITDA. Overstate it at origination, and every downstream calculation in the credit file is built on a false foundation. As private credit markets have expanded rapidly, reaching an estimated $1.5 to $2.0 trillion in assets at end-2024 according to the Financial Stability Board, the pressure to accept aggressive add-backs has grown alongside competition for deals. Disciplined lenders must be able to defend every dollar of EBITDA they underwrite.
The Analytical Framework: Three Layers of EBITDA
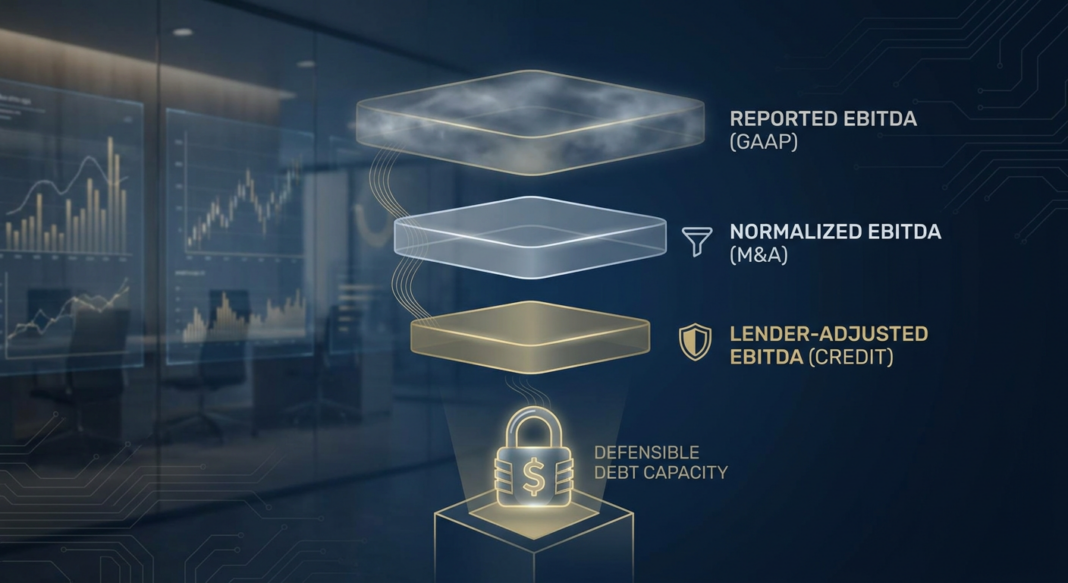
Professional credit underwriting distinguishes between three distinct versions of EBITDA, each serving a different purpose in the analysis.
Layer 1: Reported EBITDA
This is the GAAP starting point: earnings before interest, taxes, depreciation, and amortization as shown in the company’s financial statements. It is the most verifiable figure but often the least representative of ongoing cash generation. It may include revenue from discontinued business lines, extraordinary cost events, or non-recurring income that inflates the base year.
Layer 2: Normalized EBITDA
Normalized EBITDA removes items that distort the company’s recurring earnings power. As defined by M&A practitioners, normalized EBITDA refers to historical earnings after removing non-recurring, non-operating, unusual, or owner-specific items so the business can be valued on a more representative earnings base. Typical normalization adjustments include:
- Removal of one-time legal, litigation, or settlement costs
- Normalization of owner/founder compensation to market-rate replacement cost
- Exclusion of revenue or costs from discontinued operations
- Reversal of non-cash charges with no economic substance (e.g., certain stock-based compensation)
- Correction for accounting-period timing differences
Layer 3: Lender-Adjusted EBITDA (The Credit Committee Number)
This is the most conservative, evidence-tested version. Lenders are usually cautious, and they will only consider adjustments that can be clearly justified and traced back to the company’s financial statements. Specifically, a lender-adjusted figure applies additional haircuts to:
- Pro forma synergies: Only credit synergies that are already contractually in-place or demonstrably realized in trailing periods.
- Run-rate revenues: New customer contracts or pricing changes should be credited only when supported by executed agreements with a track record of at least two to three quarters.
- Cost eliminations: Planned cost-outs that have not yet been implemented receive zero credit in the base underwrite. If the sponsor insists, size them conservatively and require a remediation covenant if they are not achieved within 12 months.
Example: $10M EBITDA Manufacturing Company
| EBITDA Layer | Amount | Delta |
|---|---|---|
| Reported EBITDA (GAAP LTM) | $8.5M | – |
| + Owner compensation normalization | $0.6M | +$0.6M |
| + One-time facility relocation expense | $0.5M | +$0.5M |
| = Normalized EBITDA (Management) | $10.8M | – |
| – Unrealized synergy add-back (no executed contracts) | ($1.2M) | –$1.2M |
| – Haircut on run-rate revenue (single-quarter track record) | ($0.4M) | –$0.4M |
| = Lender-Adjusted EBITDA (Credit Committee) | $9.2M | –$1.6M vs. mgmt. |
At 5.0x leverage, that $1.6M EBITDA gap is the difference between $46M and $54M of supportable debt, a structurally significant underwriting divergence.
Walking Through the Analysis: Add-Back Forensics and Covenant Impact
The normalization exercise must be systematic, not negotiated. A Quality of Earnings (QoE) analysis is the diligence process that tests the earnings bridge, evaluating revenue recognition, customer concentration, gross margin trends, add-back support, accounting cutoffs, and the relationship between EBITDA and cash flow. The QoE report (commissioned by the buyer or lender, not the seller) is the primary document for establishing the credit committee EBITDA.
Step 1: EBITDA-to-Cash-Flow Reconciliation
Every EBITDA figure must be reconciled to actual operating cash flow. If EBITDA rises but the company is not bringing in more cash from regular operations, that could mean the improved earnings are just on paper. The reconciliation bridges EBITDA to free cash flow by accounting for: (a) cash interest expense, (b) maintenance capex, (c) taxes paid in cash, and (d) working capital movements. A business reporting $10M of EBITDA but converting only $4M to free cash flow raises fundamental questions about cash generation quality.
Step 2: Margin Trend Analysis (Three-Year LTM Review)
Build a trailing 12-month EBITDA bridge for each of the prior three fiscal years plus the current LTM period. Identify: (a) whether gross margins are expanding or contracting, (b) whether SG&A as a percentage of revenue is trending up, and (c) whether the add-back volume is growing year-over-year. An increasing add-back stack relative to reported EBITDA is a red flag; it suggests management is increasingly relying on adjustments to hit the earnings target rather than operational performance.
Step 3: Covenant-Measured EBITDA Delta
Once you have established the credit committee EBITDA, identify the covenant-measured EBITDA, the definition used in the credit agreement for maintenance covenant compliance. These two numbers are often different. If the gap between reported EBITDA and covenant-measured EBITDA exceeds 15–20%, escalate for credit committee review. A wide gap means the company could trip a covenant on reported EBITDA while appearing compliant on the covenant schedule, a dangerous blind spot.
Step 4: Stress Test the Normalized Figure
Apply a 15–20% revenue decline to the lender-adjusted EBITDA with simultaneous 150–300 basis point margin compression (reflecting cost stickiness). Calculate the resulting leverage ratio and interest coverage in the downside case. Institutional lenders typically require 20–30% headroom in the base case so that normal operating variance does not trigger an immediate breach.
Industry Standards: What Institutional Lenders Are Watching in 2026
The EBITDA normalization debate is not academic. It has direct implications for credit performance across the middle market. Several key data points frame the current risk environment:
📊 Credit Performance Data Box
- Default rate range (private credit, 2025): Moody’s estimates the 2025 private credit default rate ranged from 1.6% (excluding distressed exchanges) to 4.7% (including them), a 3.1-percentage-point spread driven entirely by how restructurings are counted. Source: Moody’s, May 2026.
- Distressed exchanges as share of all defaults: 65% of all corporate defaults in 2025 were distressed exchanges, not hard payment defaults. Source: Moody’s Default & Recovery Database, May 2026.
- Post-restructuring re-default risk: More than one in four distressed exchanges ultimately ends in a hard default; more than one in three ends in either a hard default or a second distressed credit event, with 70%+ of eventual hard defaults occurring within two years of the initial restructuring. Source: Moody’s, May 2026.
- Lower middle market default pressure: KBRA’s forecast placed the lower middle market default rate at approximately 3.5% by borrower count, with downgrades outpacing upgrades for seven consecutive quarters. Source: Alternative Credit Investor / KBRA, November 2025.
- Interest coverage stabilization: Interest coverage ratios for direct lending have stabilized around 2.0x following the 2022–2023 rate shock, but remain compressed, particularly for companies with EBITDA below $25M. Source: J.P. Morgan Private Bank, April 2026.
- FSB warning on EBITDA add-backs: The Financial Stability Board’s May 2026 private credit vulnerabilities report noted that EBITDA adjustments, particularly synergy-based add-backs, inflate reported leverage ratios in ways that may obscure true borrower risk. Source: FSB Vulnerabilities in Private Credit Report, May 2026.
What Institutional Lenders Are Requiring in 2026
Private credit lenders are increasingly focused on how a business generates cash, how it plans to use capital, and how it will behave under pressure, and EBITDA quality is the first screen. Experienced platforms are tightening EBITDA definitions in credit agreements, requiring QoE reports from independent third parties rather than accepting management-prepared adjustments, and flagging credits where the add-back stack exceeds 20% of reported EBITDA as requiring senior credit committee escalation.
The improved market backdrop does not reduce the need for underwriting discipline; it increases the value of it. In a more active deal environment with more transactions to evaluate, the ability to say no (grounded in a rigorous, repeatable EBITDA normalization methodology) is the core competency that separates durable credit platforms from those that will face credit deterioration in the next downturn.
Common Red Flags in EBITDA Presentations
- Synergy add-backs without executed contracts: Future cost saves from an acquisition that have no contractual basis or operational plan should receive zero credit at underwriting.
- EBITDA growth driven entirely by add-backs: If reported EBITDA is flat but adjusted EBITDA is growing, the growth is a presentation artifact, not a business improvement.
- PIK income inflating coverage ratios: As the FSB notes, payment-in-kind loans allow borrowers to defer cash interest by adding it to principal, providing liquidity but increasing total debt and long-term credit risk. PIK income should be stripped from coverage ratio calculations.
- Customer concentration masking revenue quality: A company generating 40% of revenue from a single customer requires a separate concentration-adjusted EBITDA that haircuts the at-risk revenue by at least 50% in the downside case.
- Working capital seasonality obscuring LTM figures: A trailing 12-month period that ends at peak inventory or accounts receivable will overstate normalized cash generation.
The EBITDA Normalization Underwriting Checklist
Before any credit committee presentation, a lender’s analyst should be able to answer every question below. If any answer is "unknown" or "pending," the credit should not proceed.
- Source Document Verification: Has every add-back been traced to a specific line item in the audited financial statements or management accounts? Are adjustments supported by third-party invoices, board resolutions, or executed contracts, not just management assertions?
- QoE Report Commissioned: Has an independent Quality of Earnings report been completed by a credentialed accounting firm? Does it cover revenue recognition, customer concentration, gross margin trends, and cash conversion?
- Three-Year EBITDA Bridge Built: Has the analyst constructed a year-by-year EBITDA bridge covering FY-2, FY-1, FY (most recent), and LTM? Does the bridge identify whether the add-back stack is growing or shrinking as a percentage of reported earnings?
- EBITDA-to-Free Cash Flow Reconciliation Complete: After deducting cash interest, maintenance capex, taxes, and normalized working capital movements, what is the free cash flow conversion rate? Is it above 65%? If below 50%, flag for credit committee.
- Synergy Add-Backs Haircut: Have all forward-looking synergy add-backs been reviewed against the evidence standard? Is each synergy either (a) contractually locked in, (b) already in-period realized, or (c) excluded from the credit committee EBITDA?
- Covenant-Measured EBITDA Identified: Has the analyst identified the precise EBITDA definition in the draft credit agreement? Is the delta between the credit committee EBITDA and the covenant-measured EBITDA documented and within the acceptable 10–15% threshold?
- Downside EBITDA Stress Modeled: Has the analyst applied a 15–20% revenue decline with 150–300 bps of margin compression? What is the resulting leverage ratio and DSCR? Does downside DSCR remain above 1.25x?
- Customer Concentration Adjustment Applied: If any single customer represents more than 20% of revenue, has a concentration-adjusted EBITDA been calculated for the downside case?
- PIK and Non-Cash Income Stripped: Has all PIK interest income, mark-to-market gains, and other non-cash income been excluded from the coverage ratio calculation?
- Sponsor Track Record Reviewed: Has the sponsor’s historical support for portfolio companies under stress (including equity cures, additional capital, and management interventions) been independently assessed?
Key Takeaways
- Reported EBITDA is always the wrong number. Every credit underwrite requires a lender-adjusted EBITDA that is independently derived, evidence-supported, and more conservative than both management’s adjusted figure and the seller-side CIM presentation.
- The add-back stack is a leading indicator of credit risk. When normalized EBITDA grows faster than reported EBITDA over multiple periods, it signals that management is relying on adjustments, not operations, to hit earnings targets. This is one of the clearest pre-close red flags in middle-market underwriting.
- EBITDA-to-cash-flow conversion is the real test. A business generating $10M of EBITDA but only $4M of free cash flow has a structural cash consumption problem that leverage ratios alone will not reveal. Always reconcile to actual cash generated and trace working capital movements.
- Covenant-measured EBITDA gaps create hidden default risk. A wide spread between credit committee EBITDA and covenant-measured EBITDA means compliance certificates can look clean while the underlying credit deteriorates. Map this delta before close and require tight covenant definitions that limit add-back capacity.
- The 2025–2026 default data demands conservatism. With 65% of 2025 corporate defaults structured as distressed exchanges rather than hard defaults, and over one-in-three of those restructurings leading to a second credit event, the borrower cohort that restructured in 2023–2024 is now in its highest-risk window. EBITDA normalization discipline at origination is the most direct line of defense against joining that cohort.


