
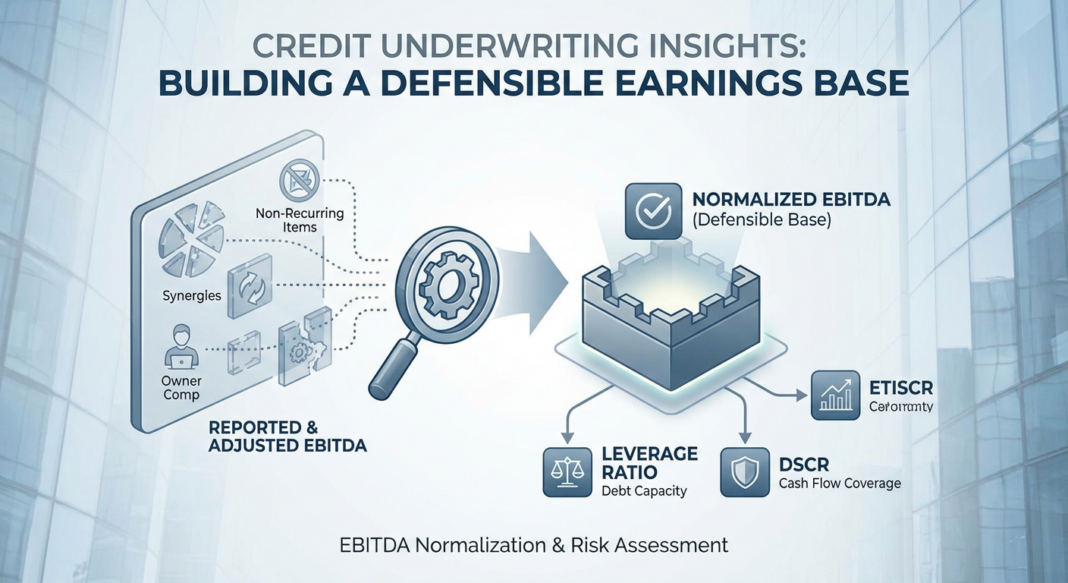
The Underwriting Challenge: Which EBITDA Are You Actually Lending Against?
Every middle-market credit starts with the same question: What does this business actually earn? It sounds simple. In practice, it is one of the most contested calculations in leveraged finance.
When a borrower or sponsor presents a Confidential Information Memorandum, the headline Adjusted EBITDA figure typically reflects management’s most optimistic interpretation of the earnings base: a bridge that removes one-time costs, credits future synergies, and normalizes owner compensation to whatever level the narrative demands. The problem for lenders is structural: every dollar of accepted add-back is multiplied by the leverage ratio to determine debt capacity. A single $500,000 add-back accepted at 5.0x leverage implies $2.5 million in additional borrowing capacity. Reject it, and the deal structure may no longer pencil.
This is why EBITDA normalization is not a back-office accounting exercise. It is the foundational underwriting decision that sets leverage, sizes the facility, determines covenant triggers, and drives loss severity in a downside scenario. Lenders who treat the seller’s schedule as a starting point (and build their own independent, evidence-based normalized EBITDA) consistently outperform those who accept the CIM at face value.
This article explains how disciplined credit underwriters build a defensible normalized EBITDA, what they challenge, what they accept, and how the resulting figure flows through to debt service coverage, covenant headroom, and recovery analysis.
The Analytical Framework: Three Layers of Earnings Scrutiny
Experienced lenders distinguish between three distinct earnings figures, each with a different role in underwriting:
- Reported EBITDA: The figure derived directly from GAAP financial statements, no adjustments applied.
- Adjusted EBITDA: Management’s version, incorporating add-backs for items claimed to be non-recurring, non-cash, or owner-specific. This is typically the figure presented in the CIM.
- Normalized EBITDA: The lender’s independently verified estimate of sustainable, recurring operating earnings. This is the number that drives credit decisions.
As practitioners at Auxo Capital Advisors note, auxocapitaladvisors.com: normalized EBITDA “starts with reported EBITDA, removes non-recurring, non-operating, and owner-specific items, and then adjusts for supportable run-rate effects that a buyer or lender can reasonably rely on.” The key phrase is can reasonably rely on, this is the lender’s threshold, not the seller’s.
The formal process that pressure-tests the bridge between these three figures is called a Quality of Earnings (QoE) analysis. According to auxocapitaladvisors.com, a QoE review “commonly evaluates revenue recognition, customer concentration, revenue quality, gross margin trends, add-back support, reserves, accounting cutoffs, working-capital behavior, cash conversion, and the relationship between EBITDA and cash flow.” Critically, the OCC’s guidance on credit risk rating confirms that sound underwriting “provides protections such as coordinating repayment with cash flow, covenants, and collateral”, all of which depend on starting with a credible earnings base. (occ.gov)
Example: Analyzing a $10M EBITDA Manufacturing Company
A sponsor presents the following EBITDA bridge for a precision parts manufacturer:
| Line Item | Amount ($000s) | Lender Assessment |
|---|---|---|
| Reported EBITDA (LTM) | $7,200 | Verified from audited financials |
| + Owner compensation above market | $600 | ✓ Accepted, documented, market comp cited |
| + One-time litigation settlement | $400 | ✓ Accepted, court records confirm non-recurring |
| + "COVID-related" supply chain costs | $350 | ✗ Rejected, costs recurred in 2023 and 2024 |
| + Pro-forma cost synergies (unrealized) | $900 | ✗ Rejected, no implementation plan or track record |
| + Stock-based compensation (SBC) | $250 | △ Partial credit, non-cash but represents real economic cost to equity |
| − Below-market related-party rent (upward normalization) | ($150) | ✗ Add-down applied, lease will reset to market at close |
| Lender-Accepted Normalized EBITDA | $8,200 | vs. Sponsor’s $9,700, a $1.5M delta |
At a 5.0x senior leverage target, that $1.5M delta reduces available debt capacity by $7.5 million, a material underwriting difference that affects both the deal’s feasibility and the lender’s risk exposure.
Walking the Calculations: From Normalized EBITDA to Credit Decision
Once a lender establishes their normalized EBITDA, three critical calculations flow from it:
1. Debt / EBITDA (Leverage Ratio)
This is the primary sizing metric for most middle-market credit facilities. ferdinandpartners.com confirms that “lenders underwrite acquisition financing based on Debt/EBITDA ratios and fixed charge coverage ratios.” An inflated normalized EBITDA that lenders do not independently verify “does not support the debt capacity needed to achieve target returns.” In the current environment, mostlymetrics.com notes that most transactions are clearing at 5.0x leverage for businesses with real earnings and strong cash conversion, with premium assets reaching 6.0x.
Formula: Total Debt ÷ Lender-Accepted Normalized EBITDA
In our example: $41M debt ÷ $8.2M normalized EBITDA = 5.0x leverage (vs. 4.23x if the sponsor’s $9.7M EBITDA were accepted, a meaningful difference in risk profile).
2. Debt Service Coverage Ratio (DSCR)
DSCR measures a borrower’s ability to service all fixed obligations from operating cash flow. pioneercapitaladvisory.com notes that “if EBITDA normalization is overly aggressive, DSCR may appear acceptable on paper but fail during underwriting”, one of the most common reasons credit deals stall or restructure post-close. Institutional lenders require a minimum base-case DSCR of 1.25x, with the prior Bond Capital stress-testing framework noting that the downside DSCR floor of 1.25x must hold even under a 15–25% revenue decline scenario. (bondtv.vaultai.ca)
Formula: (Normalized EBITDA − Capex − Cash Taxes − Cash Interest) ÷ Scheduled Principal Repayment
3. Covenant Headroom Analysis
Finally, the normalized EBITDA establishes where covenants are set. Bond Capital’s stress-testing framework establishes that “institutional lenders typically require 20–30% headroom in the base case so that normal operating variance does not trigger an immediate breach.” (bondtv.vaultai.ca) If the normalized EBITDA is inflated, the covenant is calibrated against a fiction, and breaches arrive faster and with less warning.
The Add-Down Problem: Normalization Is Bidirectional
Most lenders focus on challenging add-backs. But windsordrake.com highlights that normalized EBITDA can be lower than reported EBITDA when costs must be added back upward: “If the business benefits from under-market rent paid to a related party, or if owner labor is underpaid relative to a market replacement, a buyer may normalize costs upward, which reduces EBITDA.” In our manufacturing example, the below-market related-party lease, which will reprice at close, reduced normalized EBITDA by $150,000. Lenders who miss add-downs systematically overstate earnings coverage.
What Institutional Lenders Look For, and What the Default Data Confirms
The stakes of EBITDA normalization precision are not theoretical. The private credit default data from 2024–2025 makes the consequence of mispriced earnings explicit.
📊 Data Box: Private Credit Default & Distress Metrics (2024–2025)
- Fitch Ratings (March 2026): U.S. private credit default rate reached a record 9.2% in 2025, following a prior record of 8.1% in 2024. Smaller issuers with $25M or less in EBITDA made up the majority of defaults. (usnews.com)
- KBRA Q4 2025 Compendium: 25% of monitored middle-market borrowers carried a sub-1.0x interest coverage ratio, the lowest since Q3 2024, but still elevated. Downgrades outpaced upgrades for two consecutive years. (kbra.com)
- Proskauer Private Credit Default Index (Q2 2025): Default rate fell to 1.76% for senior-secured/unitranche loans, but companies with EBITDA of $25M–$49.9M showed a notably elevated 2.9% rate in Q2 2025. (proskauer.com)
- ZCG Credit Insights (Feb 2026): Borrowers with less than $10M in EBITDA showed covenant default rates above 31%, while PIK interest now accounts for over 8% of BDC income, double pre-COVID levels, signaling growing liquidity stress masked by headline performing loan statistics. (zcg.com)
- S&P Global: Trailing 12-month high-yield default rate above 4% through September 2025, near long-term averages of approximately 4.5%. (valuationresearch.com)
These figures point to a consistent pattern: smaller borrowers with thinner EBITDA buffers, exactly the segment where aggressive add-backs are most prevalent, account for a disproportionate share of defaults and distress. The academic research reinforces this. A University of Houston study (Bauer College) found that non-GAAP EBITDA add-backs weaken the efficacy of EBITDA-based covenants and lead to deterioration in long-term loan and borrower performance, and critically, this elevated risk is not fully priced into loan spreads. (bauer.uh.edu)
Common Red Flags That Experienced Lenders Flag Immediately
- Pro-forma cost savings with no implementation plan: Future synergies that haven’t materialized are a canonical EBITDA inflation tactic. As windes.com notes, “pro-forma fluff”, future savings baked into the asking price, is among the most common red flags that can destabilize a deal.
- Recurring "non-recurring" items: If the same category of add-back appears in two or more consecutive periods, it is recurring by definition. Lenders review three years of financials specifically to identify this pattern.
- One-sided adjustment schedules: windes.com is direct: “presenting only add-backs raises immediate red flags.” A credible EBITDA bridge includes both positive and negative normalization.
- Revenue-cost asymmetry: ferdinandpartners.com identifies the specific risk: “removing [cost] from normalized EBITDA while retaining the associated revenue creates an internally inconsistent margin profile.”
- SBC added back in full: Stock-based compensation represents real economic value transferred to employees. ferdinandpartners.com notes that many PE buyers specifically exclude SBC when calculating debt capacity, as lenders “should not extend credit against earnings that are inflated by adding back genuine compensation costs.”
- EBITDA-to-cash flow divergence: A quality of earnings (QoE) ratio below 1.0x, where reported net income exceeds operating cash flow, is a structural warning sign that earnings may be overstated through aggressive accrual accounting or delayed expense recognition. (etonvs.com)
The macro environment reinforces the case for conservatism. As pkfod.com summarizes the 2025–2026 credit landscape: “limited partners at PE funds demand further transparency and lenders are tightening underwriting standards”, a direct response to the vintage-year deterioration visible in default cohort data.
The EBITDA Normalization Underwriting Checklist
Use this framework on every new credit opportunity. Each point should be documented in the credit memo.
Step 1: Establish the Reported Base
- ☐ Obtain three full fiscal years of audited financials plus the most recent trailing twelve months (TTM). bakertilly.com confirms that buyers “rely on the most recent information, specifically the trailing 12-month (TTM) period for setting value and for debt financing underwriting.”
- ☐ Reconcile management accounts to audited figures. Unexplained variances between management and audited EBITDA require written explanation.
- ☐ Compute the QoE ratio: Operating Cash Flow ÷ Net Income. A ratio below 0.85x warrants deeper scrutiny of revenue recognition and accrual timing.
Step 2: Interrogate Every Add-Back
- ☐ Apply the four-part test used by experienced PE underwriters (auxocapitaladvisors.com): Is the adjustment (a) historical and fact-based, (b) under management’s control, (c) likely to survive independent QoE review, and (d) something lenders will credit in their own underwriting?
- ☐ Test each add-back across all three years of financials. If it recurs, it is not non-recurring.
- ☐ Require primary source documentation: legal invoices for litigation, board minutes for restructuring charges, payroll records for compensation normalization.
- ☐ Apply a hard cap on total add-backs as a percentage of reported EBITDA (many institutional lenders use a 15–20% informal ceiling as a trigger for heightened scrutiny).
Step 3: Apply Add-Downs
- ☐ Identify below-market related-party rent or management fee arrangements that will reprice post-close.
- ☐ Normalize owner compensation downward if the seller is underpaid relative to a market replacement.
- ☐ Identify deferred maintenance capex or underfunded insurance that a new owner must absorb.
- ☐ Adjust for key-person dependencies: if the owner’s departure requires new senior hires, model the cost.
Step 4: Validate Revenue Quality
- ☐ Customer concentration: does any single customer exceed 15–20% of revenue? Assess contractual protection and renewal history.
- ☐ Revenue recognition policy: is revenue recognized on a completed-contract vs. percentage-of-completion basis? Timing matters for EBITDA timing accuracy.
- ☐ Revenue durability: distinguish between contracted/recurring revenue and project-based/one-time revenue streams. Only the former deserves full credit in normalized EBITDA.
Step 5: Flow Through to Credit Metrics
- ☐ Calculate leverage ratio on lender-accepted normalized EBITDA. Document the delta vs. sponsor’s EBITDA.
- ☐ Calculate base-case DSCR. Confirm it exceeds 1.25x after maintenance capex, cash taxes, and scheduled amortization.
- ☐ Set covenant triggers at 20–30% below normalized EBITDA to provide operating headroom without false comfort. (bondtv.vaultai.ca)
- ☐ Run a downside scenario: apply a 15–20% revenue haircut to normalized EBITDA. If DSCR falls below 1.0x, re-evaluate facility size or require structural protection (cash sweep, reserve account).
Documentation Requirements
- ☐ Independent QoE report from a third-party accounting firm (required by most institutional lenders for facilities above $10M).
- ☐ Lender’s own EBITDA bridge in the credit memo, explicitly noting which add-backs were accepted, partially credited, and rejected.
- ☐ Management representation letter confirming completeness of disclosed adjustments.
- ☐ Post-close monitoring trigger: normalized EBITDA must be recalculated and compared to covenant EBITDA at each quarterly compliance certificate.
Key Takeaways
- Normalized EBITDA is lender-constructed, not seller-presented. Seller-provided schedules are a starting point. The lender’s independent normalized figure (stripped of unsupported add-backs and inclusive of add-downs) is the only number that should drive facility sizing and covenant setting.
- Every accepted add-back is leveraged. At a 5.0x multiple, a $500,000 add-back represents $2.5M in incremental debt exposure. The financial and credit risk of each adjustment must be priced accordingly, and the academic evidence confirms that aggressive add-backs correlate with deteriorating long-term loan performance.
- The default data validates conservatism. Fitch’s record 9.2% private credit default rate in 2025, concentrated among small-EBITDA borrowers, and KBRA’s finding that 25% of middle-market borrowers carry sub-1.0x interest coverage ratios are a direct consequence of earnings bases that didn’t survive the credit cycle.
- Add-downs are as important as add-backs. Lenders who only challenge upward adjustments systematically overstate the earnings base. Below-market related-party arrangements, undercompensated owners, and deferred capex all reduce the true normalized earnings available to service debt.
- Covenant design starts with normalized EBITDA. A covenant set against an inflated earnings base provides false security. The 20–30% headroom standard only functions as intended when the underlying EBITDA reflects economic reality, making the normalization exercise inseparable from covenant discipline.


