
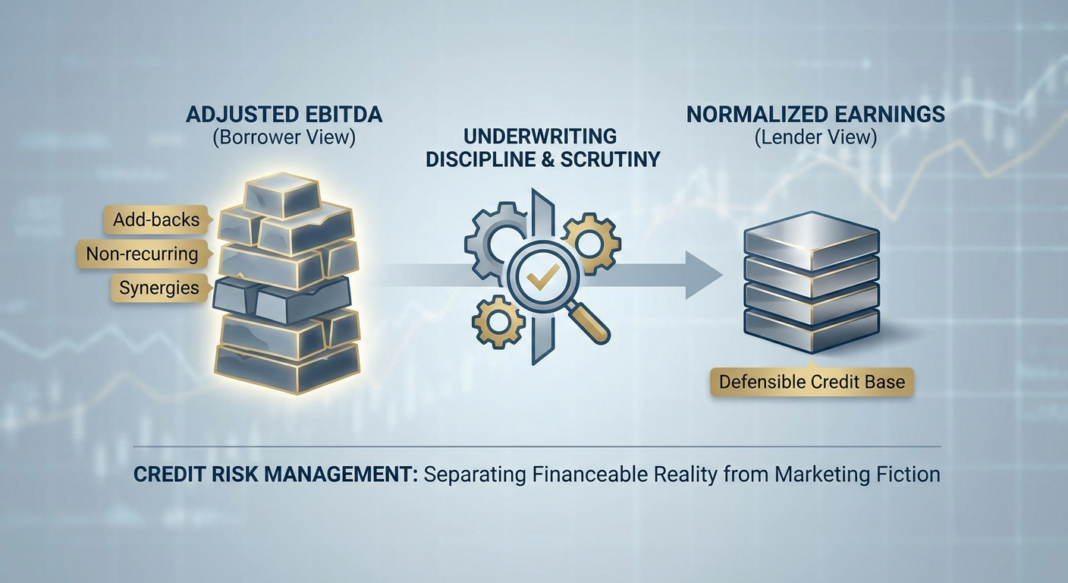
EBITDA Adjustments & Normalization: The Underwriter’s Discipline for Defensible Earnings
When a borrower presents $10M in Adjusted EBITDA, how much of it will a credit committee actually underwrite? This practitioner guide breaks down the normalization methodology, add-back scrutiny, key credit metrics, and red flags that separate financeable earnings from marketing fiction.
The Underwriting Challenge
A private equity sponsor submits a Confidential Information Memorandum (CIM) for a $10M EBITDA specialty manufacturing business. Page 14 includes an add-back schedule that lifts reported EBITDA by $2.1M: owner compensation normalization, a one-time legal settlement, pandemic-era PPP expense, and three years of “non-recurring” IT infrastructure upgrades. The sponsor’s ask: underwrite the full $10M EBITDA and fund a 5.5x leverage deal.
This scenario plays out every week across direct lending desks, and it is the central analytical challenge in middle market credit underwriting. Adjusted EBITDA is not a GAAP metric. It is a negotiated construct, and every dollar a lender accepts in add-backs directly determines debt capacity, coverage ratios, and ultimately, credit loss exposure.
The stakes are measurable. According to the Moody’s Credit Strategy Report (July 2025), the leveraged loan default rate is projected to reach 7.5% by year-end 2025, nearly double the 3.4% historical average. In this environment, every basis point of EBITDA inflation that survives credit committee is a basis point that erodes the margin of safety when a borrower hits stress. Disciplined normalization is not a diligence formality; it is the first line of credit defense.
The Normalization Framework: From Reported to Underwritable EBITDA
Experienced lenders distinguish between three distinct earnings figures in any credit package:
- Reported EBITDA: The GAAP-derived figure from audited or reviewed financial statements. The starting point, not the conclusion.
- Adjusted EBITDA: Management’s version after applying proposed add-backs. Often the figure in the CIM. Seller-provided schedules are viewed as a starting point, not a conclusion, lenders independently evaluate each item during underwriting.
- Normalized EBITDA: The buyer-underwritable estimate of sustainable, recurring operating earnings after removing non-recurring, non-operating, and owner-specific items, and crucially, after applying downward adjustments where the business has been underinvesting or mispricing internal costs.
The practical implication: Adjusted EBITDA can be higher or lower than Reported EBITDA. A credible EBITDA bridge includes both add-backs and add-downs. If the seller charges below-market rent through a related entity, or the owner-operator has been drawing below a market replacement salary, a disciplined lender normalizes those costs upward, reducing the financeable EBITDA base even if it reduces headline appeal.
Illustrative Example: $10M EBITDA Manufacturing Company
| Line Item | Amount ($000s) | Lender Treatment |
|---|---|---|
| Reported EBITDA (Audited) | $7,900 | Accepted as base |
| + Owner Compensation Excess (above $350K market rate) | +$650 | Accepted, documented W-2 evidence required |
| + One-Time Legal Settlement (2024) | +$400 | Partially accepted, requires counsel letter confirming resolution |
| + “Non-Recurring” IT Upgrade (Year 3 of 3) | +$300 | Rejected, recurring capex pattern disqualifies as add-back |
| + PPP Loan Forgiveness Income (excluded) | +$250 | Rejected, non-operating, non-repeatable |
| – Below-Market Related-Party Rent Normalization | –$200 | Applied downward, market lease comparables used |
| – Underfunded Maintenance Capex | –$300 | Applied downward, sustaining capex added back to expenses |
| Lender Normalized EBITDA | $8,500 | Underwritable base for leverage and coverage calculations |
Illustrative example for methodology demonstration only. Not a representation of any actual transaction.
The delta between the sponsor’s $10M and the lender’s $8.5M is $1.5M, at a 5.5x leverage ask, that represents $8.25M of debt the lender would not support. This is not a minor rounding difference. It is the difference between a fundable and an unfundable deal at the proposed structure.
Walking Through the Credit Metrics
Once Normalized EBITDA is established, lenders build the credit box around three core metrics:
1. Total Leverage (Debt / Normalized EBITDA)
Using the lender’s $8.5M base versus the sponsor’s $10M, a $46.75M debt package produces dramatically different leverage readings:
- Sponsor’s view: $46.75M ÷ $10M = 4.7x leverage
- Lender’s view: $46.75M ÷ $8.5M = 5.5x leverage: at or above most senior secured lender credit policy limits for this sector
2. Debt Service Coverage Ratio (DSCR)
Lenders independently calculate DSCR using normalized cash flow after accounting for taxes, required capex, and working capital. If EBITDA normalization is overly aggressive, DSCR may appear acceptable on paper but fail during underwriting, one of the most common reasons credit transactions stall or collapse at the committee stage.
A standard DSCR floor for senior secured middle market loans is 1.20x. At a blended interest rate of 9.5% on $46.75M of debt (~$4.4M annual cash interest), plus $1.5M in required amortization, the debt service load is ~$5.9M. Against lender EBITDA of $8.5M (less $1.2M estimated taxes and $0.8M sustaining capex = $6.5M available cash flow), DSCR calculates to approximately 1.10x: below the lender floor, and insufficient without structural enhancement.
3. Fixed Charge Coverage Ratio (FCCR)
Lenders underwrite acquisition financing based on Debt/EBITDA ratios and fixed charge coverage ratios. Any inflated normalized EBITDA that lenders do not accept in their own underwriting does not support the debt capacity needed to achieve target returns. The FCCR test catches this: it measures (EBITDA – Capex – Taxes – Distributions) ÷ (Interest + Scheduled Principal), and a sponsor-friendly EBITDA that doesn’t survive lender scrutiny will collapse the FCCR to covenant-breach territory within 12 months of a modest revenue softening.
What Institutional Lenders Require: Market Standards & Credit Data
The tightening of credit underwriting standards is not anecdotal; it is a structural response to a deteriorating default environment. As competition between broadly syndicated lenders and direct lenders intensifies, covenant flexibility has increasingly migrated from public markets into private credit structures, putting greater pressure on underwriting discipline to compensate for structural softening.
📊 Credit Market Data Snapshot (2025–2026)
- Leveraged Loan Default Rate: Moody’s projects the leveraged loan default rate at 7.5% by year-end 2025, projected to peak at 7.9% in Q1 2026, nearly double the 3.4% historical average. (Source: Moody’s Credit Strategy Report, July 2025)
- Distressed Exchanges: Distressed exchanges accounted for approximately 64% of all defaults in H1 2025, roughly the same pace as all of 2024, itself the highest annual share on record. (Source: Moody’s Ratings, July 2025)
- Private Credit Loss Rates: The Cliffwater Direct Lending Index (CDLI), covering ~23,000 directly originated middle market loans totaling $560 billion, produced an estimated annualized credit loss of 1.47% for the broader index (senior + non-senior). (Source: Cliffwater CDLI / Morgan Stanley Investment Management, 2025)
- Senior Direct Lending Returns: The Cliffwater Direct Lending Index returned 4.5% through H1 2025, with some softening observed as spreads compressed from refinancing activity. (Source: iCapital / Cliffwater, August 2025)
- EBITDA Credibility Gap: In competitive transaction markets, a 20% to 40% discrepancy has been observed between seller’s initial marketing EBITDA and the sustainable earnings verified during due diligence. (Source: Dealsuite, 2025, as cited by Ferdinand Partners)
- QoE Adoption: Over 70% of M&A transactions now require formal financial due diligence and Quality of Earnings analysis, a sharp increase from prior-cycle norms. (Source: OGS Capital, 2025)
What Experienced Lenders Penalize
Private equity firms and institutional lenders approach EBITDA adjustments with a layered underwriting process. They ask whether the adjustment is historical or forward-looking, whether it is under management’s control, whether it will survive third-party Quality of Earnings review, and whether lenders will give credit for it in financing discussions. The cleanest adjustments are historical and fact-based, not aspirational.
Common issues that trigger lender haircuts or deal re-structuring include:
- Recurring “one-time” costs: Restructuring charges, legal fees, or IT upgrades that appear in three consecutive years are by definition recurring. Buyers and lenders will reject these adjustments and may penalize the overall credibility of the add-back schedule.
- Stock-based compensation (SBC) add-backs: SBC is non-cash but represents real economic value transferred to employees. Many sophisticated lenders exclude SBC when calculating debt capacity because extending credit against earnings inflated by adding back genuine compensation costs understates true leverage.
- Asymmetric revenue-cost adjustments: If a seller adjusts revenue upward for any reason, the cost side must move symmetrically. One-sided adjustments that improve margin profiles without acknowledging the cost of sustaining them are among the most technically aggressive presentations in any normalization bridge.
- Weak cash conversion: A quality of earnings ratio below 0.90 (operating cash flow ÷ EBITDA) signals that reported earnings are not fully supported by cash: a red flag for aggressive revenue recognition, delayed expense reporting, or accounting irregularities.
The Lender’s EBITDA Normalization Checklist
The following checklist reflects institutional underwriting practice for middle market credit due diligence on EBITDA normalization and add-back review:
📋 Step-by-Step Diligence Protocol
Phase 1: Documentation Assembly
- ☑ Obtain three full fiscal years of audited (or reviewed) financial statements plus interim YTD
- ☑ Request management-prepared EBITDA bridge with line-item support for every add-back >$25K
- ☑ Obtain third-party Quality of Earnings report (required for transactions >$25M debt) or commission independently
- ☑ Pull bank statements for the trailing 12 months to reconcile EBITDA to actual cash receipts
Phase 2: Add-Back Interrogation
- ☑ Classify every add-back as: (a) historical/fact-based, (b) owner-specific, or (c) forward-looking/aspirational
- ☑ Test recurrence, any “one-time” item appearing in 2+ consecutive periods must be justified or rejected
- ☑ Validate owner compensation adjustments against market comp surveys (industry + geography)
- ☑ Check related-party transactions (rent, management fees, intercompany loans) against arm’s-length market data
- ☑ Identify SBC, PPP, insurance proceeds, and other non-operational income, exclude from EBITDA base
Phase 3: Downward Normalization
- ☑ Assess sustaining capex requirement vs. reported D&A, if maintenance capex consistently exceeds D&A, apply the delta as an EBITDA reduction
- ☑ Test working capital adequacy, rising DSO or inventory build signals potential EBITDA-to-cash conversion deterioration
- ☑ Review unrecorded liabilities: accrued PTO, deferred maintenance, unfunded benefit obligations, warranty reserves
- ☑ Stress-test customer concentration: if top 3 customers >40% of revenue, haircut EBITDA to reflect concentration risk in scenarios
Phase 4: Credit Metric Construction
- ☑ Calculate Debt / Normalized EBITDA, Total Leverage, Senior Leverage, and Net Leverage
- ☑ Calculate DSCR and FCCR at base case, 15% EBITDA stress, and 25% EBITDA stress
- ☑ Confirm all credit ratios are within lender policy thresholds using lender’s normalized EBITDA, not management’s
- ☑ Document and present the EBITDA delta between management’s view and lender’s underwritten view, with rationale for each haircut
Key Questions to Ask Management
- ☑ “Can you provide the invoice and board resolution for each one-time item claimed?”
- ☑ “Has this category of expense appeared in any of the prior three fiscal years?”
- ☑ “What will annual maintenance capex be under the new ownership structure?”
- ☑ “Are there any customer contracts expiring, renegotiating, or under dispute within the next 18 months?”
- ☑ “What is the business’s operating cash conversion ratio (CFO ÷ EBITDA) over the last three years?”
Key Takeaways: Risk Discipline in EBITDA Underwriting
- Lenders underwrite normalized EBITDA independently, not management’s version. Seller-provided add-back schedules are a starting point for diligence, not a conclusion. Every adjustment must survive independent lender scrutiny, third-party QoE review, and credit committee challenge.
- EBITDA inflation compounds at the multiple. A single $300K add-back rejected at a 6x valuation multiple represents $1.8M of enterprise value and directly reduces the debt capacity the deal can structurally support. At scale, this determines whether a transaction is fundable.
- Normalized EBITDA can be lower than Reported EBITDA. Downward normalization (for below-market rent, underfunded maintenance capex, understated compensation, or unrecorded liabilities) is as analytically important as add-back analysis, and often overlooked under deal pressure.
- Cash conversion is the most honest validator. A quality of earnings ratio (Operating Cash Flow ÷ EBITDA) consistently below 0.85x is a structural red flag suggesting that reported earnings are not being converted to cash, regardless of how clean the add-back schedule appears.
- The default environment demands more discipline, not less. With leveraged loan default rates near double historical averages and distressed exchanges comprising the majority of credit events, the EBITDA normalization process is the primary lever lenders control at origination. Every dollar of add-back accepted without evidence is a dollar of credit risk that cannot be recovered after closing.


