
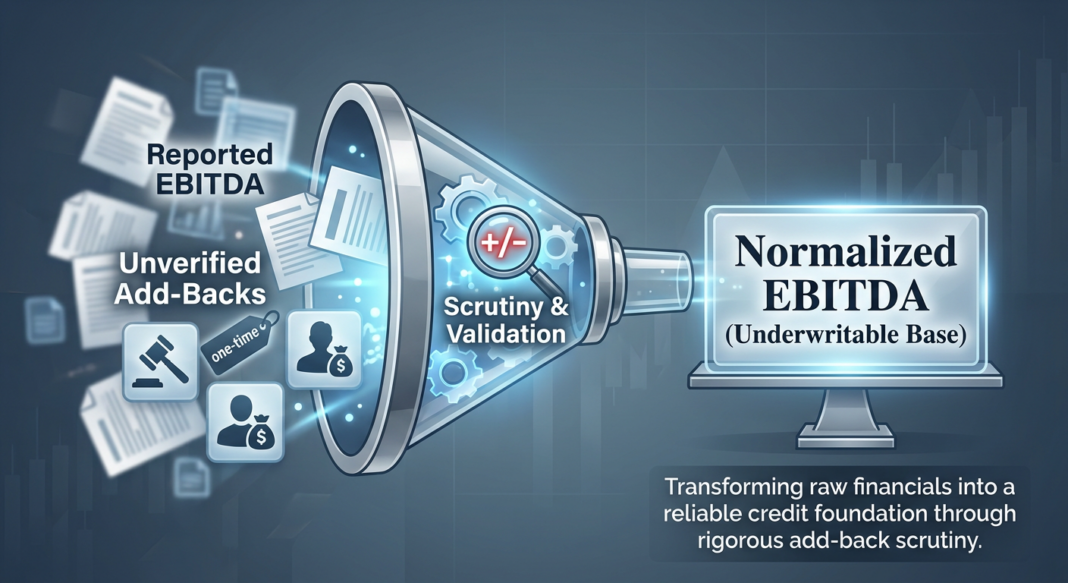
The Underwriting Question Every Lender Must Answer
A founder-led manufacturing business is seeking $33 million in senior secured debt to support a private equity buyout. The Confidential Information Memorandum presents $12 million in Adjusted EBITDA: up from $8 million reported on audited financials. The bridge includes $1.5M in owner compensation normalization, $900K in one-time legal fees, $750K in “non-recurring” facility costs, $500K in M&A transaction expenses, and $300K in “pro-forma” cost savings that have not yet materialized.
Before a single term sheet is issued, the credit underwriter faces the discipline’s most consequential question: Which version of EBITDA are we actually lending against?
This distinction is not semantic. At a 6.5x valuation multiple, a single $550K reduction in accepted EBITDA erases $3.6 million of enterprise value, and directly reshapes maximum debt capacity, leverage covenant headroom, and loss-given-default exposure.
The current lending environment makes this analysis more critical than ever. Macro uncertainty, sustained high base rates, and tightening LP oversight have triggered what practitioners describe as a fundamental shift toward more disciplined underwriting behaviors. Limited partners at PE funds are demanding greater transparency, and lenders are systematically tightening standards in response. In this environment, the gap between a seller’s highest adjusted EBITDA and the number a credit committee will actually capitalize has never been wider, or more consequential.
The Normalization Framework: Reported → Adjusted → Normalized
Experienced underwriters distinguish among three distinct earnings figures, each serving a different function in the credit process:
- Reported EBITDA: The number on the audited or reviewed financial statements. The starting point, not the conclusion.
- Adjusted EBITDA: Management’s first pass at add-backs. Typically the figure presented in the CIM. As one advisory firm summarizes it: “Adjusted EBITDA is often management’s first pass at add-backs.”
- Normalized EBITDA: The earnings base a buyer or lender can sustainably underwrite: adjustments that survive third-party Quality of Earnings review, are historical and fact-based, and reflect what the business will actually generate under new ownership.
The practical underwriting question, as one middle-market advisory practice frames it: which version of EBITDA is being multiplied? Normalized EBITDA is the defensible estimate used in lender underwriting and deal negotiation; it differs from adjusted EBITDA because buyer-accepted normalization requires stronger evidence, cleaner definitions, and consistency with the rest of the diligence record.
The Four Categories of Legitimate Add-Backs
A rigorous EBITDA bridge groups adjustments into four buckets, each with distinct evidentiary standards:
- Non-Recurring Items: One-time legal settlements, unusual repairs, discontinued product lines, and COVID-era disruptions. Each must be evidenced as genuinely singular. If an “exceptional” cost appears every year, it is no longer exceptional.
- Owner-Specific Normalization: Excess compensation above a market replacement wage, personal expenses run through the business, and discretionary perks. Conversely, if the owner is underpaid, lenders normalize costs upward, reducing EBITDA to account for a realistic market salary.
- Related-Party Economics: Below-market rent paid to an owner-controlled entity, management fees, or intercompany charges must be reset to arm’s-length market rates. These can move EBITDA in either direction.
- Run-Rate Adjustments: Annualizing the impact of mid-year changes, a new contract signed in Q3 or a headcount reduction completed in Q4. These require the highest evidentiary bar: documented contracts, payroll records, or confirmed purchase orders, not management projections.
What Lenders Categorically Reject
Certain adjustments do not survive institutional underwriting regardless of how they are packaged:
- Pro-forma synergies that have not been operationally demonstrated
- Balance sheet reclassifications (moving items between accounts does not generate cash)
- Shareholder distributions or intercompany cash transfers presented as operational income
- Capitalized expenses that provide no future financial benefit, a common accounting maneuver that understates current-period costs
- Revenue recognized early to inflate the measurement period
Walking Through the Analysis: A $10M EBITDA Manufacturing Borrower
Consider a representative middle-market manufacturer presenting the following EBITDA bridge to support a $33M senior secured facility request:
| Line Item | Seller’s Claim | Lender’s Underwritten View | Rationale |
|---|---|---|---|
| Reported EBITDA | $8.0M | $8.0M | Starting point; audited |
| Owner comp normalization | +$1.5M | +$0.9M | Partial credit; market replacement salary required |
| One-time legal fees | +$0.9M | +$0.9M | Documented; accepted in full |
| “Non-recurring” facility costs | +$0.75M | $0 | Similar cost appeared in prior year; not non-recurring |
| M&A transaction expenses | +$0.5M | +$0.5M | Standard; accepted with documentation |
| Pro-forma cost savings | +$0.35M | $0 | No implementation evidence; future-looking only |
| Normalized EBITDA | $12.0M | $10.3M | $1.7M gap; materially changes debt capacity |
From EBITDA to DSCR: The Debt Sizing Test
With underwritten Normalized EBITDA of $10.3M, the credit team now runs the DSCR calculation to evaluate whether the $33M facility is supportable. The standard formula:
DSCR = Adjusted Free Cash Flow ÷ Annual Debt Service
Adjusted FCF = EBITDA − CapEx − Cash Taxes − Working Capital Change
= $10.3M − $1.2M − $0.8M − $0.3M = $8.0M Adjusted FCF
Annual Debt Service (5% on $33M, 7-year term) ≈ $3.35M interest + $4.7M principal = $8.05M
DSCR = $8.0M ÷ $8.05M = 0.99x: Below every institutional threshold.
The deal as structured does not clear a minimum DSCR of 1.20x–1.25x, which represents the baseline across institutional lenders today. Lenders in leveraged buyout contexts typically require a DSCR between 1.10x and 1.35x, with a preference for ratios closer to 2.0x for lower-risk credits. At a maximum leverage of 4.0x–4.5x Normalized EBITDA ($41M–$46M facility capacity), the $33M request is technically within range, but only if all EBITDA adjustments are accepted. At the underwritten $10.3M, senior debt capacity falls to approximately $27M–$31M, requiring the deal to be recut.
The Cash Flow Litmus Test
Beyond leverage and DSCR, underwriters apply one additional quality screen: the ratio of Cash Flow from Operations to Net Income. A ratio consistently above 1.0x signals high-quality earnings because the business is generating more cash than it reports in net income. A ratio persistently below 1.0x, even when EBITDA looks healthy, is a material red flag suggesting aggressive revenue recognition, rising accounts receivable, or earnings that are on paper only.
What Institutional Lenders Are Seeing in 2025–2026
The current credit cycle is providing a sobering calibration for EBITDA underwriting discipline. The following data points (drawn from Moody’s, Fitch, and independent credit research) illustrate why every EBITDA dollar demands rigorous verification:
📊 Credit Performance Data Box
- Private Credit Default Rate Range (2025): Moody’s analysis places the private credit default rate between 1.6% and 4.7%, depending on whether distressed exchanges are included. Distressed restructurings accounted for approximately 65% of all defaults in 2025.
- Leveraged Loan Market Default Rate: Projected to end 2025 at 7.5%, nearly double the historical average of 3.4%, with an estimated 7.9% in Q1 2026, according to Moody’s.
- Fitch Private Credit Universe: The U.S. private credit default rate reached 9.2% for 2025 within Fitch’s Privately Monitored Ratings portfolio, up from 8.1% in 2024, with the highest incidence among issuers with EBITDA of $25M or less.
- Distressed Exchange Prevalence: Distressed exchanges accounted for 64% of all defaults in H1 2025 (the same pace as all of 2024, which was the highest annual share on record) with the loan market exhibiting the most distress, particularly PE-backed borrowers with loan-only capital structures.
- DSCR Minimums (2026): Institutional lenders have broadly reset minimum DSCR thresholds. Several top-tier lenders have moved from 1.20x to 1.25x for stabilized assets, with transitional credits requiring 1.30x or higher. Stress rates are often applied 50–100 basis points above the actual note rate.
- QoE Penetration: Over 70% of M&A transactions now require formal financial due diligence via QoE, with 84% of lenders requiring detailed documentation for all normalization adjustments. Template-driven reports no longer suffice.
Common Underwriting Mistakes
Even experienced credit teams fall into predictable traps when evaluating EBITDA adjustments:
- Accepting recurring costs as non-recurring. If a cost labeled “exceptional” appears in two or more of the last three years, it belongs in run-rate expenses. No exceptions.
- Ignoring add-downs. Adjusted EBITDA can be lower than reported EBITDA. Below-market related-party rent, underpaid owner labor, deferred maintenance, and underfunded benefit obligations all reduce normalized earnings. A credible EBITDA bridge must include both add-backs and add-downs.
- Over-crediting pro-forma savings. Cost synergies that depend on integration actions not yet taken, or operational improvements tied to the founder’s personal productivity, receive no credit in institutional underwriting until they are contractually locked or operationally demonstrated.
- Relying on the audit as a substitute for QoE. Audits verify historical GAAP compliance. A Quality of Earnings analysis determines whether that compliance reflects sustainable cash flow. They answer fundamentally different questions. A QoE review evaluates revenue recognition, customer concentration, revenue quality, gross margin trends, add-back support, reserves, accounting cutoffs, working-capital behavior, cash conversion, and the relationship between EBITDA and actual cash flow.
- Ignoring customer concentration. Any customer contributing over 10% of revenue represents a material concentration risk, a standard red flag in QoE analysis that directly impacts the quality and durability of the EBITDA base.
Bond Capital Underwriting Checklist: EBITDA Normalization Diligence
The following step-by-step framework guides the credit team from initial CIM review through investment committee approval:
Phase 1: Initial Screening (Pre-LOI)
- ✅ Request 3 years of audited or reviewed financials plus trailing-twelve-month management accounts
- ✅ Build independent EBITDA bridge from reported to adjusted; do not use management’s schedule as a starting point
- ✅ Compute preliminary leverage ratio (Total Debt / Normalized EBITDA) and DSCR on underwritten FCF
- ✅ Flag any add-back exceeding 5% of reported EBITDA for deep-dive documentation requirements
- ✅ Identify any customer representing >10% of revenue; obtain customer contract terms and renewal history
Phase 2: Quality of Earnings Diligence
- ✅ Engage independent QoE provider; align scope to credit thesis (growth vs. stabilization vs. restructuring)
- ✅ Test all non-recurring expense add-backs: Was this cost present in prior periods? Obtain invoices, legal billings, and board authorizations.
- ✅ Normalize owner compensation against market replacement cost data; require HR support or comp study
- ✅ Validate all related-party transactions (rent, management fees, intercompany services) against market comparables; require arm’s-length contracts
- ✅ Challenge all pro-forma adjustments: require signed contracts, payroll records, or operational evidence, never management projections alone
- ✅ Run the Cash Flow from Operations / Net Income ratio for each of the last 3 years; investigate any year below 0.90x
- ✅ Reconcile reported revenue to bank deposits (Proof of Cash); investigate discrepancies
- ✅ Review accounts receivable aging; flag receivables >90 days overdue exceeding 10% of the total AR balance
- ✅ Assess inventory obsolescence, unrecorded liabilities (accrued vacation, warranty reserves), and deferred maintenance CapEx
Phase 3: Stress Testing and Structuring
- ✅ Run base case, downside (-15% EBITDA), and severe downside (-25% EBITDA) scenarios on DSCR and leverage
- ✅ Confirm DSCR clears 1.20x minimum in base case and 1.00x minimum in downside case
- ✅ Set Total Debt / EBITDA covenant at or below 4.0x–4.5x for middle-market credits; include step-down schedule
- ✅ Include maintenance covenants on DSCR (minimum 1.10x tested quarterly) and minimum liquidity (minimum 90-day cash runway)
- ✅ Document rationale for every accepted and rejected add-back in the credit memorandum
Key Takeaways for Credit Underwriters
- 🔍 Management’s adjusted EBITDA is a starting point, not a conclusion. Seller-provided schedules are reviewed as the beginning of independent analysis. Lenders underwrite normalized EBITDA, the figure that survives third-party QoE review, not the highest management presentation.
- 📈 Every accepted add-back is multiplied by the valuation multiple. A single rejected $550K add-back at a 6.5x multiple eliminates $3.6M of enterprise value and directly shrinks senior debt capacity. The stakes of add-back discipline compound with deal size.
- 🚫 Distressed exchanges are the dominant default mechanism in private credit today. With distressed restructurings accounting for ~65% of all defaults in 2025 and leveraged loan default rates approaching 8%, underwriters who anchor debt to inflated EBITDA face elevated loss severity when restructurings occur.
- ⚠️ The Cash Flow / Net Income ratio is a fast-moving early warning signal. A ratio persistently below 1.0x, regardless of EBITDA strength, indicates earnings that are not converting to cash, which materially undermines debt service capacity in a downside scenario.
- 📋 QoE is a risk management tool, not a transaction formality. With over 70% of institutional transactions now requiring formal QoE, lenders who bypass this process or rely on management representations are systematically underpricing the risk of EBITDA erosion post-close.


