
Market Headline: A Regime Change for Credit Capital
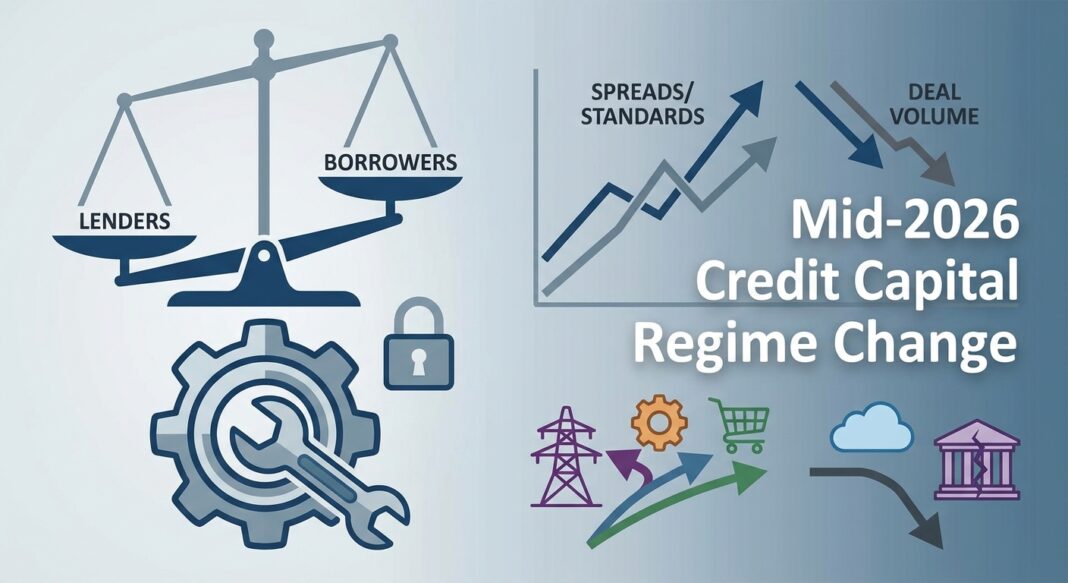
Mid-2026 marks a meaningful inflection point across credit markets. After years in which abundant capital and compressed spreads empowered borrowers to dictate terms, the balance of negotiating leverage has shifted decisively toward lenders. Three converging shocks (the U.S.-Iran military conflict, an AI-driven reassessment of software credit quality, and a wave of Business Development Company (BDC) redemption requests) have collectively reset the pricing and structural parameters of private credit, particularly in the middle market.
The macro backdrop compounds these pressures. The Federal Reserve held its target federal funds rate steady at 3.50%–3.75% through Q1 2026, flagging elevated inflation pressures and geopolitical uncertainty, while the April 2026 FOMC shift toward a rate pause, with conditions that could warrant future hikes, has pushed market participants to price out meaningful easing for the foreseeable future. This “higher-for-longer” posture continues to weigh on debt serviceability across leveraged capital structures, compressing fixed charge coverage ratios and widening the dispersion in borrower credit quality.
The current environment is not a systemic crisis, but it is a credit cycle in transition. For operators and investors who understand the evolving data (on spreads, lender appetite, KPI thresholds, and sector rotation) the next 12 months present both material risks and differentiated opportunities.
Quantitative Market Snapshot
The table below synthesizes current pricing, volume, and credit quality data across the public and private credit spectrum. All figures are sourced from institutional reports and regulatory surveys published between Q1 and Q2 2026.
| Metric | Current Level (Q1–Q2 2026) | Prior Period (Q3–Q4 2025) | Direction | Source |
|---|---|---|---|---|
| Middle Market Private Credit Spreads (Direct Lending, Senior) | S+500 bps (approx.) | S+450–475 bps (mid-400s) | ↗ Widening ~50–100 bps since late 2025 | Hamilton Lane, Apr 2026; Lord Abbett, Jun 2026 |
| Direct Lending All-In Yield (First Lien) | ~8.0%–8.5% (trough range) | ~9.0%–9.5% | ↘ Declining with rate path, but still historically elevated | Morgan Stanley IM, Dec 2025 |
| High Yield Bond OAS (ICE BofA) | ~285 bps | ~250–260 bps (early 2026 estimates) | ↗ Modest widening YTD | InvestmentGrade.com / ICE BofA via FRED, May 2026 |
| BSL Secondary B-Rated Loan Spreads | ~67 bps wider than year-end 2024 | Year-end 2024 baseline | ↗ Widened materially in Q1 2026 | Valuation Research Corp. (VRC), Apr 2026 |
| Fed SLOOS, C&I Lending Standards (Large & Mid-Market, Q2 2026) | +8.1% net tightening | +~6–8% net tightening (Q4 2025) | ↗ Continued tightening bias | Federal Reserve SLOOS via FRED, May 4, 2026 |
| Total U.S. PE Deal Value (Q1 2026) | $257.4B across 2,374 transactions | $320.4B (Q4 2025); $339.3B (Q3 2025) | ↘ Lowest quarter since Q2 2025 | Capstone Partners / PitchBook LCD, May 2026 |
| Institutional Leveraged Loan Value YoY Change (Q1 2026) | −22.5% YoY | Strong 2025 refinancing volumes ($191.8B in 2025) | ↘ Sharp volume contraction | Capstone Partners / PitchBook LCD, May 2026 |
| Private Credit Headline Default Rate (2025 est.) | ~1.6%–4.7% (adjusted); ~5% incl. LMEs | <2% headline (prior years) | ↗ Rising when distressed exchanges included | Moody's, Apr 2026; Within Intelligence, May 2026 |
| Private Credit Market AUM | ~$1.5–2.0T (direct lending); $2T+ total corporate lending | $1.3T (U.S. market, 5-year growth from $500B) | ↗ Continued structural expansion | Cleary Gottlieb, Jan 2026; Moody's, Apr 2026 |
Note: SOFR 3-month average is hovering around ~3.7%, per Capstone Partners / Chatham Financial (May 2026), underpinning all-in floating rate calculations across leveraged loan structures.
Underwriting Standards & Key Financial KPI Thresholds
The reset in lender appetite is most tangibly visible in the tightening of underwriting KPIs. Lenders entering 2026 are recalibrating the thresholds they will accept across leverage, coverage, and documentation, a meaningful departure from the covenant-lite, borrower-friendly era of 2021–2023.
Fixed Charge Coverage Ratio (FCCR): The FCCR (which measures a borrower's ability to service total fixed obligations (interest, scheduled principal, leases, and maintenance capex) from operating cash flow) has emerged as a critical gating metric for new originations. Many lenders are now requiring minimum FCCRs of 1.2x–1.5x on entry, with stress-tested floors at 1.0x. A covenant requiring a minimum 1.5x FCCR is now a common feature in new term loan documentation. The current challenge: PIK (payment-in-kind) interest exclusions from FCCR calculations have allowed coverage ratios to look artificially healthy while true leverage quietly compounds. (Source: Private Equity Bro / Direct Lending Practice Guide, Oct 2025)
Interest Coverage Compression: Higher-for-longer rates have materially impaired debt service capacity across 2021–2022 vintage deals. Interest costs for many floating-rate borrowers increased more than 50% when the Fed hiked 500+ bps, driving interest coverage ratios toward ~1.0x for the most stressed borrowers, where cash flow barely covers interest. (Source: VRC, Feb 2026) EBITDA-to-interest coverage ratios have moved modestly higher in the most recent data, consistent with a gradual recovery in borrower earnings, but the margin remains thin. (Source: Morgan Stanley IM)
Net Leverage Thresholds: Lenders are now seeking to enter new transactions at 4.5x–5.5x Net Debt/EBITDA versus the 5.5x–6.5x and beyond seen at peak cycle. EBITDA add-back scrutiny has increased materially, with adjustments representing 30%+ of reported EBITDA now receiving pushback in credit committees. (Source: Private Equity Bro)
Documentation Improvement: New loans are increasingly coming with stricter documentation: fewer PIK toggle requests, tighter collateralization, and maintenance covenants rather than incurrence-only tests. The April 2026 SLOOS confirmed that banks tightened all terms surveyed on loans to non-depository financial institutions (NDFIs), including higher premiums on riskier loans, stricter covenants, shorter maximum maturities, and lower maximum credit line sizes. (Source: Federal Reserve SLOOS, May 4, 2026)
Sector Analysis: Where Lenders Are Moving and Where They Are Pulling Back
The most consequential structural development in Q1–Q2 2026 is not aggregate spread movement; it is the profound bifurcation in lender appetite at the sector level. Capital is flowing with purpose, and capital is also retreating with purpose.
🔴 Cold Sectors: Tighter Credit, Higher Premiums
Software & Technology Services: This is the epicenter of credit stress. Private leveraged finance markets carry software exposure of approximately 20% of total private credit portfolios, versus ~13% in the broadly syndicated loan market, making this sector the dominant driver of current portfolio differentiation. (Source: Lord Abbett, citing PitchBook / Morningstar LSTA) A large cohort of enterprise software deals originated between 2019–2022 at low rates and high multiples are now stressed by both higher financing costs and the fundamental question of AI-driven revenue disruption. Lenders are evaluating AI-impacted borrowers on a case-by-case basis, and secondary spreads for technology-exposed credits are meaningfully wider than portfolio averages. (Source: VRC, Apr 2026) The January 2026 SLOOS reported that banks are less likely to approve loans to firms adversely affected by AI on net, a structural signal, not a temporary one. (Source: Federal Reserve SLOOS, Jan 2026)
Healthcare (Physician Practice Management & Roll-Ups): Healthcare has led all sectors in non-accrual rates over the past year, driven by the structural fragility of physician practice roll-ups. These businesses were underwritten on aggressive consolidation synergies, often with leverage ratios that cannot sustain current interest burdens. Consumer healthcare discretionary businesses face simultaneous pressure from spending deceleration and debt service strain. (Source: Morgan Stanley IM, Dec 2025)
Office Real Estate: Private credit lenders are actively retreating from office property exposure. Questions around secular demand shifts, compounded by AI-driven changes in workplace utilization, are materially influencing underwriting decisions. Lender appetite for office assets has diminished relative to other real estate and infrastructure segments. (Source: S&P Global Market Intelligence, Apr 2026)
🟢 Hot Sectors: Favored Lender Appetite
Utilities & Power Infrastructure: Utilities are increasingly engaging private credit providers to fund large-scale capital investment programs, historically the domain of public bond markets. Rising electricity demand tied to AI data center buildout is driving long-duration capital needs that public markets may not fully absorb at competitive pricing. This trend represents private credit's expanding role beyond middle-market corporate lending into large, capital-intensive sectors. (Source: S&P Global, Apr 2026)
Industrials & Logistics: Supply-chain resiliency investment, defense spending spillovers, and AI-driven distribution upgrades are sustaining lender interest in industrials. While energy cost pressures from elevated oil prices create headwinds for energy-intensive manufacturing, lenders with sector expertise continue to see compelling risk-adjusted opportunities in sub-sectors with predictable, asset-backed cash flows. (Source: Private Debt Investor, May 2026) Over the medium-to-long term, supply-chain localization and AI-driven e-commerce growth should support incremental industrial demand. (Source: Morgan Stanley IM)
Asset-Backed Finance & Non-Sponsored Direct Lending: With software credit under pressure, capital is rotating toward asset-backed strategies (ABF) (consumer credit, equipment finance, infrastructure debt) where collateral is tangible and cash flows are more predictable. Sector specialists who can underwrite complex, collateral-intensive structures are capturing premium pricing. (Source: Cleary Gottlieb, Jan 2026)
Distressed & Opportunistic Credit: A new cohort of distressed and opportunistic credit funds has raised more than $100 billion over the past two years, positioned to capitalize on default cycles and liability management exercises. This is among the most actively growing sub-strategies as the credit cycle transitions from expansion to stress-and-recovery. (Source: Within Intelligence, May 2026)
Implications for Operators and Institutional Investors
For Business Operators & Borrowers
The borrower-friendly era of 2021–2023 is over. Operators seeking capital in 2026 must present lenders with conservative financial projections, defensible EBITDA definitions, and documented AI-risk assessments as part of any credit narrative. The emergence of AI disruption as a critical underwriting variable means that any business exposed to software-driven revenue must proactively address the durability of that revenue and its collateral backing. Operators with near-term refinancing needs, particularly those from 2021–2022 vintage transactions, should engage lenders early, as the window for favorable amend-and-extend terms is narrowing. Refinancing issuance fell 40.6% YoY in Q1 2026, and repricing volume dropped ~38.6%, signaling that the opportunistic refinancing wave of 2024–2025 has largely exhausted itself. (Source: Capstone Partners / PitchBook LCD, May 2026)
For operators in sectors with constructive lender appetite (utilities, infrastructure, asset-backed models, and selective industrials) current conditions offer a structural window: wider spreads have not fully closed out well-structured deals, and private credit retains pricing flexibility and execution speed advantages over public markets and bank lenders for sub-$500M transactions. (Source: Cleary Gottlieb, Jan 2026)
For Institutional Investors & Lenders
The lender-friendly reset has materially improved the prospective return profile for new originations. Spreads are 50–100 bps wider than late 2025 levels, documentation is tighter, leverage is more conservative, and deal selectivity is up. (Source: Lord Abbett, Jun 2026) The structural risk is portfolio differentiation: managers with significant 2021–2022 vintage software exposure, high PIK utilization, or covenant-lite documentation face material non-accrual risk that is only partially visible in headline default rates. The distinction between investment-grade and sub-investment-grade private debt is increasingly important, as sub-investment-grade exposure (particularly in software and concentrated healthcare roll-ups) carries meaningfully different risk profiles. (Source: CNBC / Barclays, Mar 2026)
The emerging bank re-entry dynamic deserves monitoring. Bank share of buyout financings above $1B, which fell to 39% in 2023, recovered to just over 50% by 2025, and regulatory easing under Basel III Endgame recalibration could accelerate this trend in the large-cap segment. (Source: CNBC / PitchBook, Mar 2026) The core middle market, companies too large for pure bank credit but too small for the broadly syndicated loan market, remains the most defensible private credit opportunity, as these borrowers lack liquid market alternatives to pressure lenders on terms. (Source: Lord Abbett)
Forward-Looking View: H2 2026 and Beyond
The second half of 2026 will be defined by dispersion. (Lord Abbett) Moody's baseline forecast places GDP growth at roughly 1.5%, just above the historical stall speed below which defaults accelerate, leaving narrow margin for error if geopolitical or macro shocks compound existing credit stress. (Source: Moody's, Apr 2026) The FSB's May 2026 report flagged three specific systemic vulnerabilities in private credit: procyclical redemption pressures, hidden leverage through side letters and subscription credit lines, and bank interconnections through lending facilities exceeding $1.9 trillion. (Source: FSB, May 6, 2026) Investors and operators who treat these not as tail risks but as active portfolio monitoring variables will be better positioned to navigate the remainder of the cycle.
Key Market Insights
- 🔴 Spreads have reset wider, not broken: Middle market private credit spreads have widened to the S+500 context from mid-400s in late 2025, constructive for new origination economics but a margin compression signal for legacy portfolios underwritten at tighter levels. (Hamilton Lane)
- ⚠️ True default rates are masked by LME activity: The headline private credit default rate (<2%) significantly understates stress when liability management exercises and selective defaults are included, with adjusted rates approaching 5%. Covenant amendment frequency is rising. (Within Intelligence)
- 🔭 AI disruption is now a primary underwriting variable: Any deal with software exposure requires an explicit AI disruption assessment. Banks are formally less likely to approve loans to AI-adversely-affected firms. Lenders without sector-specific AI analytical capabilities face asymmetric underwriting risk. (Fed SLOOS Jan 2026)
- 📈 The sector rotation is structural, not tactical: Capital is moving from software/healthcare roll-ups toward utilities, infrastructure, asset-backed finance, and selective industrials. This rotation is driven by AI risk repricing, rate sensitivity, and collateral quality, not short-term sentiment. (S&P Global)
- 🎯 Manager selection is the alpha source in 2026: Performance dispersion between private credit managers will widen materially in H2 2026. Non-accruals, PIK usage, 2021–2022 vintage software exposure, and covenant quality are the four key differentiation metrics. The opportunity set favors experienced managers with multi-cycle credit track records and deep sector origination networks. (Lord Abbett)


