
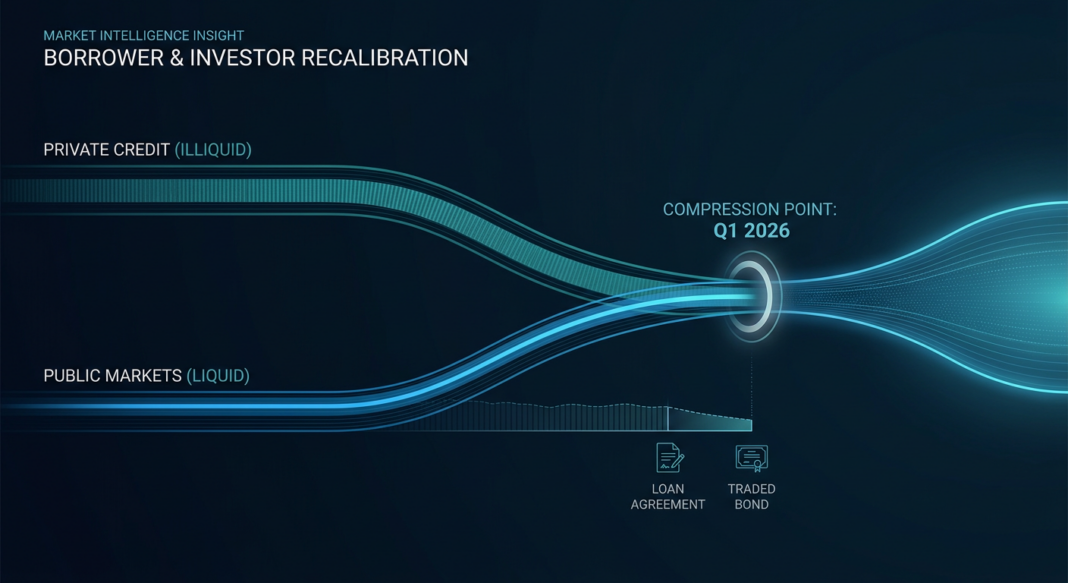
The Compression Cycle Is Now the Story
The defining macro-to-micro narrative in U.S. credit markets entering the second quarter of 2026 is not dislocation; it is compression. Across virtually every stratum of the credit stack, spreads have tightened materially from their mid-2024 peaks. Private credit, long insulated from the pricing discipline of public markets by illiquidity premiums and structural complexity, is no longer immune. The illiquidity premium, the excess yield that direct lenders have historically extracted over broadly syndicated loans (BSLs), has compressed from roughly 350 basis points in early 2025 to an estimated 270–305 basis points as of Q1 2026, per Pitchbook LCD and Cliffwater CLDI data.
That compression is not a warning sign in isolation; it reflects a credit market functioning with relatively low systemic stress. But it is a structural recalibration with direct consequences for how capital is priced, structured, and deployed across the middle market. For institutional investors benchmarking private credit returns against public alternatives, the margin of outperformance is narrowing. For borrowers, the environment is the most borrower-friendly since the pre-rate-hike era. And for operators navigating refinancing windows, the clock may be ticking on favorable terms.
The regulatory backdrop reinforces this environment. The Federal Reserve’s January 2026 Senior Loan Officer Opinion Survey (SLOOS) showed a significant easing in net tightening of C&I lending standards compared to the restrictive posture of 2023–2024, fewer banks reporting tighter standards and broader willingness to extend credit to investment-grade and upper-middle-market borrowers. The net effect: banks are selectively re-entering segments they vacated, adding competitive pressure on private lenders even as private credit AUM continues its structural ascent.
Quantitative Market Snapshot: Q1 2026
The table below captures the key pricing, volume, and underwriting metrics defining today’s credit landscape. All figures reflect Q1 2026 data or the most recent available period.
| Metric | Current Value (Q1 2026) | Prior Period (Q2–Q3 2025) | Direction | Source |
|---|---|---|---|---|
| Middle Market Private Credit Spreads (SOFR+) | S+550–625 bps | S+575–650 bps | ↘ Tighter | Cliffwater CLDI |
| Middle Market All-In Yield (Direct Lending) | 9.8%–11.2% | 10.5%–12.0% | ↘ Tighter | Cliffwater CLDI / Pitchbook LCD |
| Broadly Syndicated Loan Spreads (SOFR+) | S+280–320 bps | S+320–380 bps | ↘ Tighter | LCD / LSTA |
| High Yield Bond OAS (ICE BofA HY Index) | 275–310 bps | 330–380 bps | ↘ Near Post-2021 Tights | ICE BofA via FRED / Bloomberg |
| U.S. Direct Lending New Originations (Q1 2026) | ~$68B | ~$62B (Q4 2025) | ↗ Rising | Pitchbook LCD |
| Private Credit AUM (Global) | ~$1.75–1.8T | ~$1.5T (end-2024) | ↗ Expanding | Preqin Global Private Debt Report |
| Unitranche Leverage Multiple (Stronger Credits) | 5.0x–5.5x EBITDA | 4.75x–5.25x EBITDA | ↗ Slightly More Generous | Pitchbook LCD |
| FCCR Minimum at Close (Market Standard) | 1.20x–1.30x | 1.25x–1.35x | ↘ Slightly Loosened | Cliffwater / LCD Market Survey |
| Cliffwater CLDI Trailing 12-Month Loss Rate | ~0.6%–0.8% | ~0.9%–1.1% | ↘ Improving | Cliffwater CLDI |
| Leveraged Loan Default Rate (LCD) | ~2.1% | ~2.8% (mid-2025) | ↘ Declining | S&P Global / LCD |
The spread premium of private credit over BSLs, historically the core return justification for the illiquidity trade, now sits at its thinnest margin in three years. Lenders accepting tighter spreads must increasingly rely on structuring complexity, covenants, and fee income (OID, arrangement, PIK toggles) to defend net returns. Meanwhile, the modestly loosening FCCR floor signals that competitive pressure is beginning to bleed into underwriting standards, a dynamic that warrants close monitoring for late-cycle credit deterioration.
Sector-Specific Lender Appetite: Where Capital Is Flowing and Where It Is Retreating
Not all sectors are experiencing compression equally. The credit market in Q1 2026 reflects a bifurcated lender appetite that separates resilient, cash-generative businesses from cyclically exposed or structurally impaired sectors.
🆕 High Appetite Sectors
- Technology & Software (SaaS): Direct lenders continue to aggressively compete for high-quality software and SaaS credits. Recurring revenue models, low capex intensity, and strong retention metrics are commanding spread premiums at the tighter end, S+475–550 bps: as lenders accept lower yields in exchange for credit quality and predictability. Leverage multiples for software LBOs are being underwritten at 5.5x–6.5x EBITDA by the largest platforms, per Pitchbook.
- Healthcare Services & Life Sciences Tools: Defensive revenue profiles and demographic tailwinds continue to attract both senior secured and junior capital. Lenders are particularly active in physician practice management, behavioral health, and specialty pharma distribution, with spreads in the S+525–600 bps range for senior secured tranches.
- Infrastructure-Adjacent & Energy Transition: Data center operators, fiber networks, and renewable energy platforms are attracting project finance and term loan structures with strong lender support, partially driven by federal infrastructure investment incentives still flowing through the system per the DOE Loan Programs Office.
🔴 Constrained / Tighter Credit Sectors
- Office Commercial Real Estate (CRE): Remains the most structurally impaired segment of the credit market. Lenders (both banks and private) continue to apply significant haircuts to NOI assumptions, demand lower LTVs (55%–65% vs. historical 70%–75%), and require higher DSCR thresholds of 1.35x–1.50x, per MSCI Real Estate and SLOOS data.
- Consumer Discretionary Retail: Lenders remain cautious on brick-and-mortar dependent models, particularly those with significant lease obligations inflating fixed charges. FCCR requirements in this sector are holding firm at 1.35x+, and leverage multiples are capped at 3.5x–4.0x for most credits.
- Leveraged Media & Traditional Broadcasting: Secular audience erosion and advertiser migration continue to suppress lender appetite. Several credits in this space are being priced at S+700–850 bps with tight covenant packages, effectively rationing capital to only the most established operators.
The structural takeaway: lender appetite in 2026 is overwhelmingly biased toward recurring revenue, low fixed-cost intensity, and sector resilience, and is systematically penalizing businesses with high operating leverage, secular headwinds, or asset-heavy balance sheets.
Implications for Institutional Investors and Business Operators
For Borrowers and Operators
The current environment is the most constructive for middle-market borrowers since 2021, but the window carries conditions. Borrowers in favored sectors with clean EBITDA, strong FCCR cushion above the 1.25x threshold, and leverage below 5.0x can realistically access unitranche capital at sub-10.5% all-in yields: a meaningful improvement from the 12%+ all-in prints of 2023. Operators should act on refinancing opportunities now, particularly if existing facilities carry 2022–2023 vintage pricing. Extending duration and locking in current spreads before any Fed policy reversal tightens financial conditions is a credible strategy.
However, operators in cyclically sensitive sectors must recognize that lenders are scrutinizing fixed charge coverage ratios more dynamically, requiring borrowers to model downside FCCR scenarios, not just base-case ratios. Debt-to-equity requirements for new money transactions are holding at 40%–55% equity contribution in the middle market for sponsor-backed LBOs, limiting aggressive levering even as rate costs improve.
For Institutional Lenders and Investors
The compression in illiquidity premiums demands a strategic response. Yield-seeking investors rotating into private credit for the first time in 2026 are entering at materially lower expected returns than 2022–2023 vintages. Preqin data suggests private debt fundraising remains robust, but return expectations must be recalibrated downward toward net 8.5%–10.0% for senior strategies, versus 11%–13% in prior vintage years. Managers who can differentiate through sourcing (direct origination vs. club deals), structuring (PIK components, warrants, co-investment rights), and sector expertise will defend returns that commoditized capital cannot.
Forward-Looking View: The Next 3–6 Months
The base case for Q2–Q3 2026 is a credit market that remains broadly constructive but increasingly sensitive to macro surprises. Three dynamics warrant close monitoring:
- Fed Policy Path: Any pivot toward rate cuts, increasingly priced into forward curves per CME FedWatch, would further compress all-in yields, reducing private credit’s absolute return profile and accelerating borrower refinancing activity. Lenders should expect prepayment pressure on existing 2022–2023 vintage loans.
- Regulatory Posture on Bank Capital: The ongoing recalibration of Basel III Endgame rules under the current regulatory environment, with indications of a more measured implementation timeline per Federal Reserve Basel III guidance, could allow banks to compete more aggressively in leveraged lending, adding further pressure on private lender margins.
- Default Cycle Risk: While trailing default rates are declining, the population of 2021–2022 vintage loans underwritten at peak leverage (6.0x–7.0x EBITDA) with weak covenants is aging into a critical refinancing window. Credits with deteriorating EBITDA that cannot cover 1.15x FCCR maintenance covenants will face restructuring pressure, per S&P Global distressed pipeline analysis.
In sum, the credit cycle is in a late-expansion phase characterized by tight spreads, recovering deal volumes, and gradually loosening underwriting standards, all classic signals of a market approaching but not yet at cyclical peak risk. Disciplined capital deployment, sector selectivity, and covenant integrity will separate durable returns from ones that exist only on paper.
Key Market Insights
- 🔴 The illiquidity premium has compressed to ~270–305 bps over BSLs: the narrowest in three years, requiring private lenders to justify allocations through structuring and origination edge, not yield alone.
- 📈 Middle market all-in yields of 9.8%–11.2% remain attractive in absolute terms but represent a material decline from 2023 peak yields; 2024–2025 vintage funds carry significantly better entry points than new capital being deployed in 2026.
- 🔴 FCCR floors are quietly softening from 1.25x–1.35x to 1.20x–1.30x at close, a structural warning sign for underwriting discipline that institutional LPs and credit committees should flag in manager due diligence.
- 📈 Technology/SaaS and healthcare services are the dominant lender-preferred sectors, commanding spread compression of 75–125 bps relative to cyclical or asset-heavy credits, a structural gap, not a tactical one.
- ⚠️ The 2021–2022 vintage refinancing wave is approaching: credits underwritten at 6.0x–7.0x EBITDA with minimal covenant protection are entering their peak refinancing risk window, and distressed opportunity investors should be building pipeline now.


