
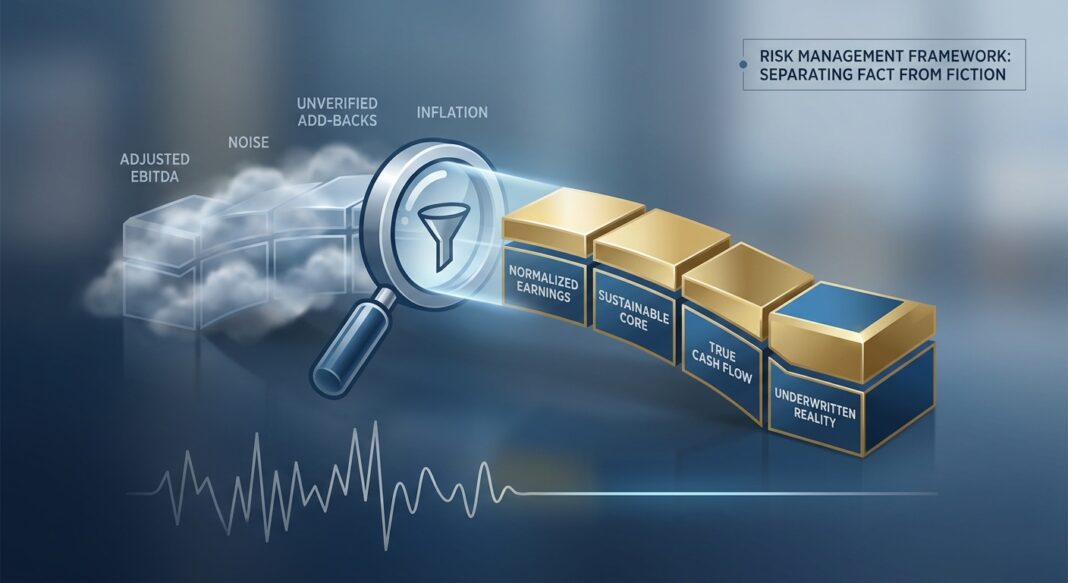
The Underwriting Challenge: When Adjusted EBITDA Becomes a Fiction
Every credit underwriter eventually encounters the same scenario: a Confidential Information Memorandum lands on the desk with an EBITDA figure that has been walked up, sometimes dramatically, through a cascade of add-backs. Owner compensation normalized here. A one-time legal settlement added back there. A consulting contract labeled as non-recurring. A growth hire treated as pro forma savings. By the time the EBITDA bridge reaches its final number, the connection to actual, recurring free cash flow has become dangerously thin.
This is not a trivial problem. Because enterprise value and leverage ratios are derived directly from EBITDA, every dollar of unsupported adjustment is multiplied by the valuation multiple applied to the deal. In practice, a single rejected $100,000 add-back at a 6x multiple represents $600,000 in implied enterprise value, and a corresponding overstatement of debt service capacity. At the portfolio level, systematic EBITDA inflation translates directly into understated leverage, overstated coverage ratios, and credit decisions built on earnings that will never materialize.
Disciplined underwriters do not ask whether an adjustment sounds reasonable. They ask whether it is historical or forward-looking, whether it is under management’s control, whether it will survive third-party quality of earnings review, and whether it reflects earnings the business can actually sustain under new ownership. That framework (applied rigorously and consistently) is the subject of this article.
The Analytical Framework: Building the EBITDA Bridge
The goal of EBITDA normalization is not to maximize earnings. It is to arrive at a sustainable, repeatable earnings base that a lender can confidently underwrite through the life of the credit. The standard methodology traces a four-step bridge:
- Reported EBITDA: GAAP earnings before interest, taxes, depreciation, and amortization, as stated in audited or reviewed financials.
- Adjusted EBITDA: Reported EBITDA after removing one-time, non-recurring, and non-operating items. This is the number most sellers present in a CIM.
- Normalized EBITDA: The sustainable, recurring subset after run-rate alignment and true pro forma effects. This is the number a lender underwrites.
- Pro Forma EBITDA: Normalized EBITDA adjusted for specific, documentable forward-looking operational changes, typically used in acquisition financing structures.
The distinction between adjusted and normalized matters enormously. Adjusted EBITDA is the bridge from reported financials to a cleaned-up earnings number after removing one-time and non-operating items. Normalized EBITDA goes further, reflecting the earnings a lender can sustainably underwrite after considering steady-state staffing, market-rate compensation, and necessary reinvestment in the business. Normalized EBITDA can be lower than adjusted EBITDA when the business requires additional costs under new ownership.
Example, Analyzing a $10M EBITDA Manufacturing Company:
Consider a specialty manufacturer reporting $7.2M in EBITDA. The seller’s CIM presents $10.0M in adjusted EBITDA after the following add-backs:
- Owner compensation above market rate: +$800K ✅ (green-light, documentable, one-time after close)
- One-time legal settlement: +$450K ✅ (green-light, supported by legal invoice)
- “Temporary” headcount reduction: +$600K ⚠️ (yellow-light, no signed contracts, operationally risky)
- Vendor renegotiation savings: +$400K ⚠️ (yellow-light, aggressive; no executed agreements in place)
- Evergreen consulting fees (recurring): +$550K 🔴 (red-light, flagged as structural overhead that recurs)
A disciplined underwriter would credit the green-light items ($1.25M), discount the yellow-light items pending documentation, and reject the red-light add-back entirely. The underwritten EBITDA drops to approximately $8.45M, a 15% haircut from the seller’s headline number, with significant downstream implications for leverage and coverage.
The Analysis: Metrics, Stress Tests, and Red Flags
Key Metrics to Calculate
Once the normalized EBITDA is established, the underwriter calculates the following core credit metrics:
- Total Leverage: Total Debt ÷ Normalized EBITDA. Institutional lenders in middle-market direct lending typically target entry leverage of 4.0x–5.5x for senior secured positions.
- Interest Coverage (FCCR): (Normalized EBITDA – Capex) ÷ Total Debt Service. A ratio below 1.20x warrants significant scrutiny in downside scenarios.
- EBITDA-to-Free Cash Flow Conversion: Compares normalized EBITDA to actual operating cash flow. A persistent gap, EBITDA rising while operating cash flow stagnates, is a structural warning sign.
- Cash Conversion Cycle: Changes in DSO, DPO, and inventory turns can reveal revenue recognition manipulation or margin pressure that EBITDA alone obscures.
Stress Testing the Earnings Base
After establishing a normalized earnings baseline, the underwriter applies downside stress scenarios across three dimensions:
- Revenue Haircut: Apply a 10–20% revenue decline (consistent with a sector-specific recession or customer concentration shock). Recalculate EBITDA and coverage ratios.
- Margin Compression: Test the impact of a 200–300 basis point gross margin deterioration: reflecting input cost inflation, competitive pricing pressure, or mix shift.
- Add-Back Rejection: Run the model assuming all yellow-light add-backs are disallowed. This is the lender’s true floor scenario.
A quality credit can absorb meaningful stress without triggering a coverage breach. A credit that can only service its debt under the seller’s pro forma scenario (and fails the moment any add-back is disallowed) carries substantially higher loss risk.
Red Flags to Watch
- EBITDA inflation without cash flow confirmation: If EBITDA goes up but operating cash flow does not follow, earnings may reflect accounting timing differences rather than real operational performance.
- “Evergreen” one-timers: Consulting fees, restructuring charges, or legal costs that appear in every trailing twelve-month period but are consistently labeled non-recurring.
- Underfunded capex: Normalized EBITDA that ignores below-market maintenance spending creates an artificially high earnings figure. Lenders must add back realistic sustaining capex to arrive at true free cash flow.
- Related-party normalization gaps: Below-market rent paid to an owner-controlled entity suppresses operating costs and inflates EBITDA. Post-close, the business pays market rent, and earnings decline accordingly.
- Key-man dependency: In founder-led businesses, the cost of replacing owner-operator labor is frequently underestimated or omitted from the normalization entirely.
Industry Standards: What Institutional Lenders See in the Market Today
The current credit environment has materially sharpened the scrutiny applied to EBITDA add-backs. An environment of macroeconomic uncertainty, elevated interest rates, and selective credit has triggered a shift toward more disciplined underwriting behaviors across institutional lenders and their LP bases. Limited partners at PE funds are demanding greater transparency, and lenders are tightening standards in response.
The consequences of under-disciplined EBITDA underwriting are now visible in default data. According to Moody’s, the leveraged loan default rate was projected to reach 7.5% by year-end 2025, nearly double the historical average of 3.4%, driven significantly by distressed exchanges, which accounted for approximately 64% of all defaults in the first half of 2025, the highest annual share on record. The most distressed segment: borrowers with loan-only capital structures backed by private equity sponsors, many underwritten at peak EBITDA multiples in 2021.
The pattern is structural, not cyclical. Covenant-lite structures, now prevalent in over 90% of broadly syndicated senior loans, strip lenders of the early warning triggers that would otherwise force renegotiation before value erodes. When cov-lite loans default, recoveries are materially lower than historical norms, because lenders had less ability to intervene before the deterioration became terminal.
For private credit and direct lending, the data tells a more resilient story, but only when underwriting discipline was maintained. According to Morgan Stanley’s analysis of the Cliffwater Direct Lending Index, credit losses for senior direct lending have been substantially lower than the broader leveraged loan market, with the CDLI-Senior producing an estimated annualized loss of well under 1% over the 2017–2025 period. The Cliffwater Direct Lending Index returned 9.3% for the full calendar year 2025, with non-accruals and realized losses holding steady or improving relative to historical averages. However, analysts have noted that 2021-vintage deals (underwritten at elevated post-COVID earnings and high leverage) have seen meaningfully weaker performance as rate normalization and operational reversion compressed post-close EBITDA.
📊 Credit Data Snapshot (2024–2025)
- Leveraged Loan Default Rate (incl. distressed exchanges): ~7.5% projected year-end 2025 (Moody’s), vs. 3.4% historical average
- High-Yield Bond Default Rate: ~3.2% for calendar year 2025, projected above 4% by Q1 2026 (Moody’s)
- Distressed Exchanges as % of All Defaults: ~64% in H1 2025, highest annual share on record (Moody’s)
- U.S. Private Credit Default Rate: Climbed to 5.7% by early 2025, up from near 0% in 2022 (Fitch, via Resonanz Capital)
- CDLI Full-Year 2025 Return: 9.3%, 20-year average of 9.5%, non-accruals and realized losses below historical averages (Cliffwater)
- Cov-Lite Prevalence: Over 90% of senior leveraged loans now carry no meaningful maintenance covenants (Resonanz Capital)
The Underwriting Checklist: EBITDA Normalization Due Diligence
The following step-by-step framework reflects institutional best practice for evaluating EBITDA add-backs during credit underwriting:
Step 1: Obtain Source Documentation
- ☐ 3 years of audited or reviewed annual financial statements plus trailing twelve months
- ☐ Monthly management accounts for the most recent 12–18 months
- ☐ Third-party Quality of Earnings report (required for transactions above $5M EBITDA)
- ☐ Trial balance and general ledger access for all flagged add-back line items
Step 2: Classify Each Add-Back
- ☐ Is the item truly non-recurring? Document occurrence frequency over the last 3 years.
- ☐ Is the item non-operational? Confirm it is not required to sustain revenue or gross margin.
- ☐ Is the item under management control? Assess execution risk if the action has not yet occurred.
- ☐ Does the item appear in the QoE? Cross-reference all seller add-backs against the independent QoE schedule.
Step 3: Apply Adddowns
- ☐ Normalize owner/operator compensation to market replacement cost
- ☐ Adjust below-market related-party rent to current market rates
- ☐ Add back deferred or underfunded maintenance capex to sustaining capex line
- ☐ Identify any underinsured risk exposures and normalize insurance costs
Step 4: Stress Test the Normalized Figure
- ☐ Run base, downside, and floor cases (all yellow-light add-backs disallowed)
- ☐ Calculate leverage and coverage ratios under each scenario
- ☐ Confirm EBITDA-to-operating cash flow reconciliation holds across all periods
Step 5: Confirm Covenant Anchor
- ☐ Set the maintenance covenant (Total Leverage or FCCR) to the normalized EBITDA figure, not the pro forma
- ☐ Build in a meaningful cushion: covenant set at no more than 85% of underwritten EBITDA
- ☐ Require quarterly compliance certificates with lender-approved EBITDA definitions locked in the credit agreement
Key Takeaways
- The EBITDA bridge is a risk document, not a marketing tool. Every add-back that survives diligence is multiplied by the valuation multiple, making unsupported adjustments a direct source of credit loss.
- Normalized EBITDA is what a lender underwrites, not adjusted EBITDA. The distinction requires accounting for steady-state staffing, market-rate compensation, and real sustaining capex, which often produce adddowns that sellers omit.
- Default data validates the risk of aggressive underwriting. With leveraged loan default rates approaching 7.5% in 2025, nearly double the historical average, and distressed exchanges masking true loss severity, the cost of underdisciplined EBITDA analysis is quantifiable and material.
- Covenant-lite structures amplify EBITDA underwriting errors. When maintenance covenants are absent, lenders lose early warning triggers. An incorrect normalized EBITDA, combined with no covenant anchor, leaves the lender with no mechanism to intervene before value deteriorates beyond recovery.
- Private credit’s resilience is a product of underwriting discipline, not asset class immunity. The Cliffwater CDLI’s strong long-run performance reflects tighter structures and more intensive monitoring, outcomes that depend entirely on a rigorous normalized EBITDA established at origination.


