
The Underwriting Question That Defines Every Deal
Every credit underwriter faces the same foundational challenge at the start of a deal: Which EBITDA number can we actually lend against? The borrower’s CIM presents an “Adjusted EBITDA” figure that may be 20%, 40%, or even 80% higher than reported net income. The sponsor’s model builds in cost savings that haven’t materialized. The add-back schedule runs three pages long. And sitting underneath all of it is a leveraged capital structure that will be tested the moment revenue softens or rates rise.
This is not a theoretical problem. In today’s private credit and leveraged lending environment, EBITDA inflation is systemic. Lenders who underwrite inflated earnings face compounding risk: they size debt too large, set covenant cushions too wide, and discover the error only when a borrower approaches distress, by which point the lender has already lost negotiating leverage.
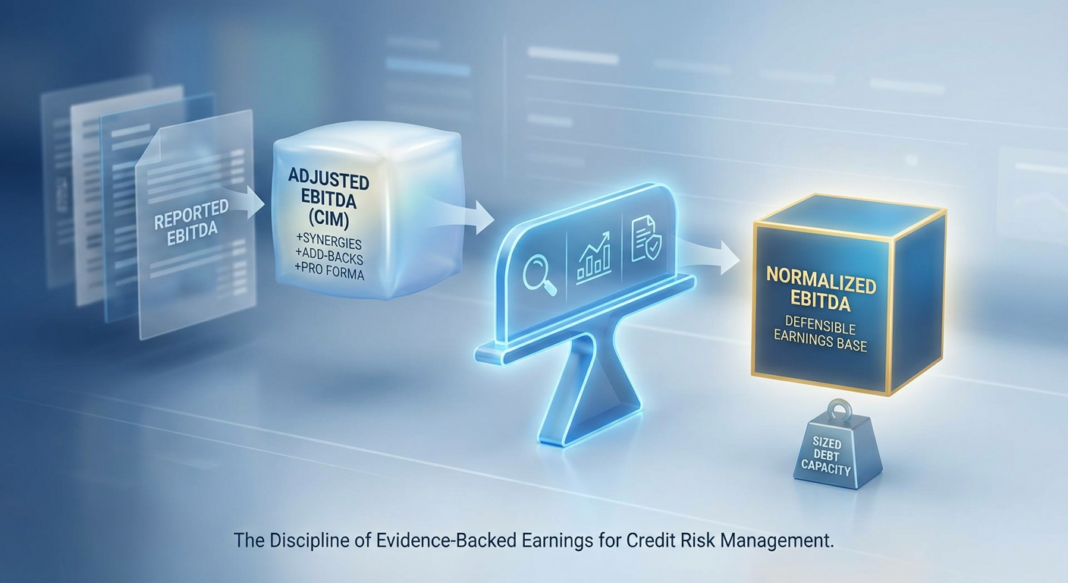
The discipline of EBITDA normalization is not about being conservative for its own sake. It is about building a defensible, evidence-backed earnings base that accurately represents what a business will generate in cash, at scale, on a recurring basis, and sizing credit accordingly. This article walks through the methodology, the metrics, and the red flags every credit professional must master.
The Framework: From Reported to Normalized EBITDA
The professional standard in middle-market underwriting distinguishes sharply between three EBITDA figures that are frequently conflated:
- Reported EBITDA: GAAP earnings before interest, taxes, depreciation, and amortization, the starting point, not the finish line.
- Adjusted EBITDA: Reported EBITDA modified by add-backs for non-recurring, non-cash, or owner-specific items. This is the figure sellers and sponsors present in CIMs.
- Normalized EBITDA: The sustainable, recurring subset of adjusted EBITDA after evidence-based vetting of every add-back, run-rate alignment, and pro forma validation.
As practitioners note, normalized EBITDA is the number lenders actually underwrite: it is the earnings figure lenders use to size leverage, set covenants, and model debt service coverage. The bridge from reported to normalized is where underwriting discipline either holds or collapses.
The normalization process follows a structured sequence:
- Start with the ledger. Reconcile the borrower’s presented EBITDA to general ledger entries and audited financials. Discrepancies at this stage are immediate red flags.
- Interrogate every add-back. Each adjustment must be objectively removable, documented, and not required to sustain revenue or gross margin. Add-backs that will return post-close (structural overhead, recurring consulting, perpetual “one-time” charges) must be rejected.
- Validate pro forma items separately. Cost savings tied to future execution, management changes, or synergies are not add-backs, they are forward projections, and lenders should require evidence of similar prior execution before crediting any portion.
- Align to run-rate reality. Annualize only periods that reflect the business’s current cost structure and revenue base. Seasonal distortions, acquisition stub periods, and one-time revenue spikes must all be adjusted.
- Cross-check to cash flow. Normalized EBITDA must reconcile to actual operating cash flow. If EBITDA rises but cash generation does not follow, the adjustments are almost certainly inflated.
Worked Example: $10M EBITDA Manufacturing Company
Consider a manufacturing borrower presenting the following in its CIM:
| Line Item | Amount | Underwriter Assessment |
|---|---|---|
| Reported EBITDA | $7.2M | Ledger-verified baseline |
| + Owner compensation above market | $0.8M | ✅ Green-light: documented, non-market comp |
| + One-time legal settlement | $0.5M | ✅ Green-light: verified, non-recurring |
| + “Temporary” vendor cost cuts | $0.6M | ⚠️ Yellow-light: no signed contract; apply 50% haircut |
| + Duplicate systems post-ERP migration | $0.4M | ✅ Green-light: migration complete, costs eliminated |
| + “Synergies” from planned hire | $0.5M | 🔴 Red-light: no offer letter, no prior execution; rejected |
| Seller’s Adjusted EBITDA | $10.0M | As presented in CIM |
| Lender’s Normalized EBITDA | $9.2M | After 50% haircut on vendor savings, synergy rejection |
The $0.8M gap between the CIM figure and lender-underwritten EBITDA translates directly into debt capacity. At a 5.0x leverage multiple, that gap represents $4.0M in debt that should never have been sized.
The Analysis: Walking Through Metrics and Stress Tests
Once normalized EBITDA is established, the underwriting analysis shifts to leverage, coverage, and cash flow sustainability.
Core Credit Metrics
| Metric | Formula | Middle-Market Benchmark |
|---|---|---|
| Total Leverage | Total Debt ÷ Normalized EBITDA | ≤ 5.0x (senior); ≤ 6.5x (total) |
| Interest Coverage (DSCR) | Normalized EBITDA ÷ Annual Interest Expense | ≥ 2.0x minimum; ≥ 2.5x preferred |
| Fixed Charge Coverage (FCCR) | (EBITDA − CapEx − Taxes) ÷ (Interest + Principal) | ≥ 1.10x–1.25x |
| Free Cash Flow Conversion | FCF ÷ Normalized EBITDA | ≥ 50%; < 40% triggers scrutiny |
| Net Leverage (Maintenance Covenant) | (Total Debt − Cash) ÷ Normalized EBITDA | Set with 25–30% headroom to base case |
Downside Stress Scenario
The normalized EBITDA must be tested under a downside case. For the manufacturing company above, a lender would model a 20% EBITDA decline (representing a modest revenue contraction or margin compression event):
- Base case EBITDA: $9.2M → Leverage: 4.9x on $45M debt
- Stress case EBITDA (−20%): $7.4M → Leverage rises to 6.1x
- Stress case DSCR: If all-in interest is $3.8M, coverage drops from 2.4x to 1.9x, still above 1.5x floor but uncomfortably close under a protracted downturn
Critically, a lender must also examine whether the add-backs themselves are stress-sensitive. If the $0.6M vendor cost savings evaporate in a downturn (because the vendor withdraws concessions), the stress case EBITDA could fall further, to $6.8M, pushing leverage to 6.6x and coverage below 1.8x. This is precisely why yellow-light add-backs require haircuts rather than full credit.
Industry Standards, Red Flags, and Credit Performance Data
What Institutional Lenders Look For
Experienced lenders apply a disciplined hierarchy to EBITDA add-backs. In corporate loan agreements, lenders focus on adjusted EBITDA because it provides a clearer picture of a borrower’s ability to generate cash flows from core operations, and they will only consider adjustments that are clearly justified and traceable to the financial statements. In practice, this means banks and direct lenders size debt on a conservative EBITDA definition specifically because it drives covenant thresholds and repayment capacity.
At the same time, sophisticated lenders in today’s environment demand that adjusted EBITDA connect directly to sustainable free cash flow, not just a static earnings snapshot. Buyers and lenders increasingly expect scenario-tested cash flow models and substantiation that aligns with business reality, particularly for complex pro forma items.
Key Red Flags in EBITDA Normalization
- 🔴 Evergreen “one-time” charges: Restructuring charges, consulting fees, or system costs that appear in multiple periods signal they are recurring operational costs, not genuine add-backs.
- 🔴 Recurring revenue relabeled as non-recurring: Discounts extended to key customers to “buy” margin, or promotional pricing that recurs annually, must be excluded from the add-back schedule.
- 🔴 Uncontracted cost savings: Vendor renegotiations without signed contracts, cost reduction plans without execution history, and synergies dependent on future management hires are speculative, not underwritable.
- 🔴 EBITDA-to-cash divergence: If normalized EBITDA rises year-over-year but operating cash flow does not follow proportionally, working capital deterioration, reserve manipulation, or revenue recognition timing issues are the likely culprits.
- 🔴 Heavily padded EBITDA definitions in loan docs: In today’s credit market, EBITDA definitions are increasingly padded with add-backs and forecasts, effectively diluting lender protections well before a formal covenant breach occurs.
📊 Credit Performance Data Box
- Leveraged loan default rate (2025 projection): Moody’s projects the leveraged loan default rate will end the year at 7.5%, rising to 7.9% in Q1 2026, nearly double the 3.4% historical average. (Source: Moody’s, July 2025)
- High-yield bond default rate: High-yield bond issuers are projected to see a realized default rate of 3.2% for calendar year 2025, rising above 4% by Q1 2026, compared to a 4.5% historical average since 1996. (Source: Moody’s, July 2025)
- Private credit default rate (Fitch): The U.S. private credit default rate climbed to 5.7% by early 2025, up from virtually 0% in 2022. (Source: Fitch, via Resonanz Capital, 2025)
- Covenant-lite market share: As of year-end 2024, covenant-lite loans represented 91% of outstanding U.S. leveraged loans, with 93% of all institutional leveraged loans issued in 2024 classified as covenant-lite. (Source: PitchBook LCD, 2024)
- Recovery rate pressure: Despite relatively stable default rates in recent years, the severity of defaults has increased significantly, with recovery rates declining materially as covenants have disappeared from the broadly syndicated loan market. (Source: J.P. Morgan / S&P / IHS Markit, via O’Connor Capital Solutions, 2024)
- S&P 2024 global defaults: The number of global corporate defaults declined slightly to 145 in 2024 from 153 in 2023, with nearly 60% classified as distressed exchanges, the highest annual share on record at that point. (Source: S&P Global Ratings, 2025)
The Covenant Connection
EBITDA normalization and covenant design are inseparable. Maintenance covenants require borrowers to meet regular financial targets, giving lenders early warning signals to monitor company health before problems become payment defaults. But when EBITDA definitions in loan agreements are heavily padded with add-backs, leverage tests allow earnings to fall 30–40% before triggering a breach, rendering covenants largely decorative. A lender who accepts an inflated EBITDA at underwriting then sets covenant headroom relative to that inflated number has effectively built a tripwire that can never be reached until the business is already in severe distress.
Underwriting Checklist: EBITDA Normalization Diligence
The following framework should be completed for every credit underwriting where adjusted EBITDA materially exceeds reported earnings:
Phase 1: Document Collection
- ☐ Three years of audited (or reviewed) financial statements, tied to tax returns
- ☐ Monthly management accounts for the trailing twelve months (TTM)
- ☐ Borrower’s add-back schedule with line-item support for each adjustment
- ☐ Quality of Earnings (QoE) report from an independent accounting firm
- ☐ Working capital analysis and cash conversion cycle data
Phase 2: Add-Back Interrogation
- ☐ Classify each add-back: Green-light / Yellow-light / Red-light (see framework above)
- ☐ Verify non-market owner compensation against industry benchmarks
- ☐ Confirm one-time legal/settlement charges are not recurring (check prior 3 years)
- ☐ For cost-savings add-backs: require signed contracts, implementation timelines, and evidence of prior execution
- ☐ Reject all pro forma “synergy” add-backs without documented execution history
Phase 3: Cash Flow Validation
- ☐ Reconcile normalized EBITDA to actual operating cash flow, flag divergences >15%
- ☐ Analyze CapEx intensity: is maintenance CapEx understated in the EBITDA bridge?
- ☐ Stress test normalized EBITDA at −15%, −25%, and −35% revenue scenarios
- ☐ Calculate DSCR, FCCR, and net leverage under base and stress cases
- ☐ Confirm working capital assumptions do not mask deteriorating receivables or inventory
Phase 4: Covenant Calibration
- ☐ Set maintenance covenant thresholds against lender-underwritten normalized EBITDA, not the CIM figure
- ☐ Size covenant headroom at 20–25% to base case (not 30–40%)
- ☐ Align EBITDA definition in loan documents to the normalized figure used at close, limit post-close add-back flexibility
- ☐ Require quarterly compliance certificates tied to the restricted EBITDA definition
Key Questions to Ask Management
- Has this specific cost savings initiative been executed successfully before in this organization?
- What happens to vendor pricing concessions if volume declines 20%?
- Which customers represent >10% of revenue, and how are their contracts structured?
- Walk me through the three largest add-backs, what would happen to each in a downturn?
Key Takeaways
- 🎯 Normalized EBITDA is not adjusted EBITDA. The critical underwriting discipline is building a defensible, evidence-backed earnings figure, not accepting the seller’s headline number. Every add-back must be traceable, documented, and truly non-recurring.
- 🎯 The EBITDA-to-cash bridge is the most important reconciliation in underwriting. If normalized EBITDA does not translate to proportional operating cash flow, the adjustments are inflated, and the credit is mispriced from day one.
- 🎯 Yellow-light add-backs demand haircuts, not binary decisions. Partial credit for uncontracted cost savings, transitional items, or management-dependent efficiencies protects against execution risk without requiring full rejection of reasonable adjustments.
- 🎯 Covenant integrity begins at underwriting. Inflated EBITDA definitions in loan documents, allowing 30–40% earnings cushions before a breach, strip lenders of their most valuable early-warning system. Covenants are only as strong as the EBITDA definition underpinning them.
- 🎯 Credit market data reinforces the stakes. With leveraged loan default rates near 7.5%, private credit default rates at 5.7%, and recovery rates declining as covenant protections erode, the cost of underwriting an inflated EBITDA has never been higher. Rigorous normalization is not conservative underwriting; it is professional underwriting.


