
The Underwriting Question That Determines Everything
A middle-market borrower presents a Confidential Information Memorandum (CIM) showing $12.5 million in EBITDA. The sponsor’s add-back schedule is seventeen line items long. Three of those items are labeled “non-recurring restructuring charges”, for the third consecutive year. Two more are “management consulting fees” that, upon investigation, route back to an entity controlled by the owner’s family. The proposed leverage multiple is 5.2x.
Which EBITDA are you underwriting?
This is the central discipline problem in credit underwriting. The earnings figure you accept as your denominator determines leverage, covenant headroom, debt service capacity, and, in a downside scenario, your recovery position. Get it wrong at origination and no covenant package will save you. The entire capital structure is built on a number that may not represent sustainable cash generation at all.
This article walks through the analytical framework for EBITDA normalization: the step-by-step process experienced credit officers use to stress-test reported earnings, classify add-backs, build a defensible underwriting base, and identify the red flags that most commonly precede credit deterioration.
The Analytical Framework: Building the EBITDA Bridge
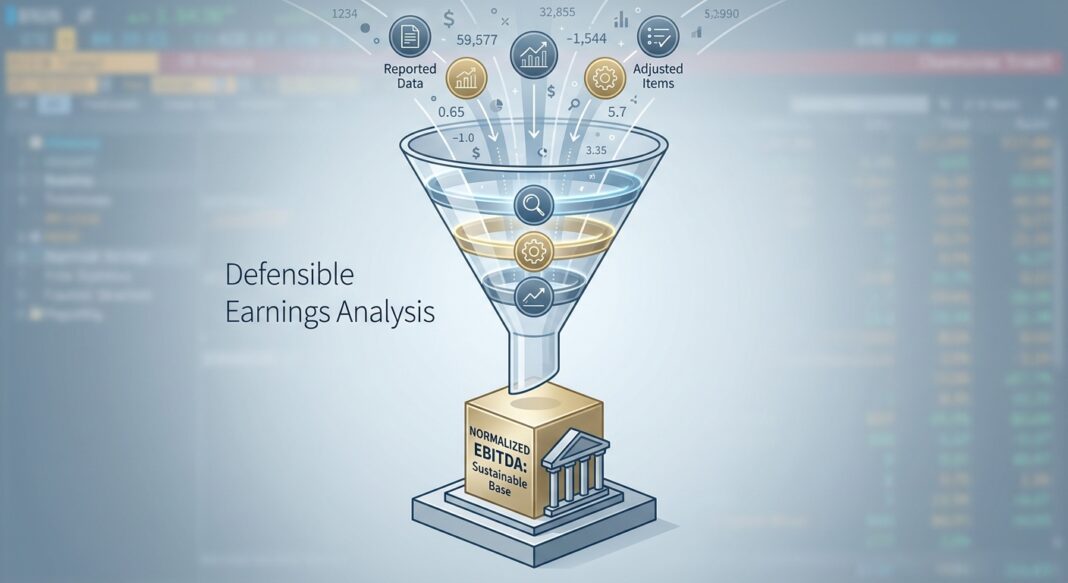
The starting point for any credit underwriting is understanding precisely what version of EBITDA you are working with. Normalized EBITDA is a defensible estimate of a company's sustainable, recurring operating earnings, adjusted to remove non-recurring, non-operating, and owner-specific items while reflecting a supportable run-rate for valuation and underwriting. It is the number lenders actually capitalize, not the headline adjusted EBITDA from the CIM.
Practitioners distinguish between three distinct earnings figures:
- Reported EBITDA: Raw GAAP earnings before interest, taxes, depreciation, and amortization, the starting point, never the ending point.
- Adjusted EBITDA: The seller-presented figure after sponsor or management add-backs: a broad umbrella that may include deal-specific, pro forma, and synergy items not yet realized.
- Normalized EBITDA: The sustainable, recurring subset of adjusted EBITDA, the only number a disciplined lender should underwrite against.
EBITDA adjustments can materially affect valuation because enterprise value is often derived by applying a multiple to the earnings figure the market accepts. In a 5.0x leverage deal, a $1 million overstatement of normalized EBITDA translates directly to $5 million of excess debt on the capital structure, with no corresponding cash flow to service it.
The formal methodology for testing these figures is a Quality of Earnings (QoE) analysis. A QoE analysis is commonly used to test adjustments and reconcile the EBITDA bridge (reported → adjusted → normalized) to the general ledger and cash.
The four-step bridge looks like this:
- Reported EBITDA (from audited or reviewed financials)
- + Green-light add-backs: Truly non-recurring, documentable, non-operational items (one-time legal costs, terminated leases, owner comp above market rate)
- − Yellow/Red-light reversals: Recurring items relabeled one-time, aggressive vendor renegotiations without signed contracts, structural overhead that returns post-close
- = Normalized EBITDA: the number you underwrite
Walking the Analysis: A $10M EBITDA Manufacturing Company
Consider a manufacturing company presenting the following CIM summary:
| Line Item | Sponsor Claim | Underwriter Assessment |
|---|---|---|
| Reported EBITDA | $8.2M | $8.2M ✔ |
| + Management consulting (owner-related entity) | $0.9M | $0.0M ✘, Related party; not market-rate; structurally recurring |
| + Legal settlement (“one-time”) | $0.7M | $0.7M ✔, Documented, non-operational |
| + Facility consolidation charges | $0.6M | $0.3M ⚠, Partially one-time; $0.3M reflects ongoing integration costs |
| + “Temporary” headcount reduction | $0.8M | $0.0M ✘, Aggressive; business requires these roles to sustain revenue |
| + Inventory write-down (prior year) | $0.4M | $0.4M ✔, Documented, non-recurring |
| Sponsor's Adjusted EBITDA | $11.6M | – |
| Underwriter's Normalized EBITDA | – | $9.6M |
The delta is $2.0 million, a 17% EBITDA overstatement. At a proposed 5.0x leverage multiple, the sponsor's figure supports $58M of debt; the underwriter's normalized figure supports $48M. That is a $10M variance in debt capacity before any stress testing begins.
Next, the underwriter applies a cash conversion bridge: Normalized EBITDA of $9.6M less maintenance capex of $1.4M, cash taxes of $0.8M, and normalized working capital build of $0.5M yields Free Cash Flow (FCF) of $6.9M. Debt service on a $48M facility at SOFR + 575 bps (approximately 10.5% all-in as of mid-2026) requires roughly $5.0M annually. That produces a Debt Service Coverage Ratio (DSCR) of 1.38x: thin, but serviceable in base case. A 15% EBITDA compression (a moderate stress scenario) drops DSCR below 1.0x and creates an immediate covenant breach.
Buyers increasingly want more comfort with how EBITDA translates to free cash flows and how recurring and predictable that is. A credit officer who only validates the EBITDA numerator without bridging to FCF is leaving the most important underwriting question unanswered.
Industry Standards, Red Flags, and Credit Performance Data
The current credit environment makes rigorous EBITDA normalization more important than ever. By late 2024, the U.S. leveraged loan default rate climbed to a decade-high of 5.6%, driven largely by distressed exchanges, surpassing the previous peak of 4.5% seen during the COVID-19 crisis in 2020. A majority of lenders surveyed by FTI Consulting expected new default and workout activity to increase further into 2025.
The composition of those defaults tells an important underwriting story. Distressed exchanges accounted for the majority of default events, and stripping out distressed exchanges, the 2024 leveraged loan default rate falls to just 1.5%. While distressed exchanges produce higher recovery rates than traditional bankruptcies, they represent a direct consequence of insufficient covenant protection, itself a downstream problem of permissive EBITDA definitions that created excess leverage at origination.
As capital inflows surged in direct lending, demand for loans increasingly outpaced supply, fueling greater borrower-friendliness and a gradual weakening of underwriting standards. The Cliffwater Direct Lending Index data cited by Morgan Stanley shows annualized net credit losses for senior direct lending of approximately 1.47% over the 2017–2025 period, a figure that masks meaningful dispersion between disciplined and undisciplined underwriters.
📊 Data Box: Credit Performance Benchmarks (2024–2026)
- U.S. leveraged loan default rate (incl. distressed exchanges): ~5.6% peak in late 2024, decade high (Source: FTI Consulting / LSEG LPC, 2025)
- Leveraged loan default rate (excl. distressed exchanges): ~1.5% in 2024 (Source: Marquette Associates, 2024)
- Moody's leveraged loan default rate forecast: Projected to reach 7.9% by Q1 2026 before easing (Source: Moody's Credit Strategy, July 2025)
- High-yield bond default rate (Moody's): 3.2% projected for calendar year 2025; historical average since 1996 is 4.5% (Source: Moody's, 2025)
- Distressed exchanges as share of all defaults: ~64% of all defaults in H1 2025, highest annual share on record (Source: Moody's, July 2025)
- U.S. private credit default rate: Rose to 5.5% in Q2 2025, up from 4.5% in Q1 (Source: Coinlaw / BofA data compilation, 2025)
- Cliffwater CDLI senior net credit losses: ~1.47% annualized (2017–2025) (Source: Morgan Stanley Investment Management / Cliffwater, 2025)
Red Flags: What Experienced Lenders Watch For
Regulated lenders have an interest in creating a thoughtful EBITDA definition that avoids unnecessarily painting an overly leveraged picture of their loan portfolio. The following patterns are among the most common precursors to credit stress:
- Evergreen "one-time" charges: Restructuring, consulting, or integration costs that appear in three or more consecutive periods.
- EBITDA-to-cash disconnect: If EBITDA goes up but the company is not bringing in more cash from its regular operations, that could mean the improved earnings are just on paper, from accounting changes or timing differences, not real growth.
- Customer concentration: Any single customer representing more than 10% of revenue warrants explicit stress-testing of revenue durability.
- Revenue pull-forward: Unusually favorable payment terms, channel-stuffing, or deferred revenue recognition that inflates the trailing period.
- Unsupported pro forma savings: For complex pro forma adjustments, buyers expect not only robust supporting evidence but also a demonstrated history of successful execution of similar cost reduction initiatives. Cost saves without signed contracts or implementation timelines should receive zero credit.
- Weak working capital discipline: DSO and DIO trends expanding faster than revenue growth signal deteriorating cash conversion and hidden liquidity pressure.
The Credit Underwriting Checklist: EBITDA Normalization Due Diligence
The following framework represents the minimum diligence standard for evaluating an EBITDA presentation in a private credit or leveraged lending context.
Step 1: Source Document Verification
- ☐ Obtain three years of audited or reviewed financial statements and trace reported EBITDA to general ledger
- ☐ Request monthly management accounts for the trailing twelve months (TTM)
- ☐ Reconcile CIM EBITDA to financial statements, unexplained variances are immediate red flags
Step 2: Add-Back Classification
- ☐ Require documentary support for every add-back > $50,000 (invoices, board resolutions, legal settlements)
- ☐ Categorize each add-back as Green / Yellow / Red using the framework above
- ☐ Stress test: what happens to leverage if all Yellow-light items are reversed?
- ☐ Check for related-party transactions: owner compensation, management fees, affiliated vendor relationships
Step 3: Revenue Quality Assessment
- ☐ Analyze revenue by customer: identify concentration (>10% threshold), contract duration, and renewal history
- ☐ Test revenue recognition policy: accrual timing, deferred revenue balances, milestone-based billing
- ☐ Verify backlog and pipeline: require customer contracts, purchase orders, or signed LOIs
Step 4: Cash Flow Bridge
- ☐ Build normalized EBITDA → FCF bridge: subtract maintenance capex, cash taxes, and normalized working capital requirements
- ☐ Calculate DSCR at current and stressed EBITDA (base case, -15%, and -25% scenarios)
- ☐ Assess cash conversion cycle: DSO + DIO − DPO trends over three years
Step 5: Independent QoE Validation
- ☐ For transactions above $20M in debt, require an independent Quality of Earnings report from a credentialed accounting firm
- ☐ Confirm QoE scope covers: revenue quality, EBITDA bridge, working capital peg, and debt-like item identification
- ☐ The QoE report should go deeper than audits, testing assumptions behind accruals, examining reserve adequacy, and stress-testing key performance drivers.
Key Questions to Ask Management
- ☐ "Walk me through the three largest add-backs, what documentation do you have?"
- ☐ "What would EBITDA have been without the cost reductions planned for post-close?"
- ☐ "What is your largest customer's contract renewal date, and what gives you confidence in retention?"
- ☐ "Why has free cash flow conversion lagged EBITDA growth over the past two years?"
Key Takeaways
- 🔑 Normalize before you size: The leverage multiple you apply is only as sound as the EBITDA denominator. Build a Reported → Adjusted → Normalized bridge with documentary support before advancing any term sheet.
- 🔑 Cash flow is the real credit metric: EBITDA is a proxy for cash generation, not a substitute. Always bridge normalized EBITDA to free cash flow and calculate DSCR at base and stressed scenarios before finalizing debt capacity.
- 🔑 The distressed exchange wave is a documentation warning: With distressed exchanges comprising over 64% of all leveraged loan defaults in H1 2025, lenders who accepted inflated EBITDA and thin covenant packages at origination are now bearing the restructuring consequences.
- 🔑 Red-light add-backs are leverage traps: Recurring costs relabeled as one-time, unsupported pro forma cost saves, and related-party management fees are among the most common pathways from aggressive underwriting to covenant breach.
- 🔑 Independent QoE is not optional at scale: An audit confirms historical compliance; a QoE confirms that earnings are underwritable. For any meaningful credit exposure, an independent QoE from a specialized accounting firm is the minimum institutional standard for defensible origination.


