
The Underwriting Problem: When the Number You’re Lending Against Doesn’t Exist
A sponsor presents a manufacturing company with $12.4 million in adjusted EBITDA. The CIM is clean. The growth narrative is compelling. The proposed leverage is 4.5x. On paper, it looks institutional-grade.
Then your credit team builds the EBITDA bridge, reported to adjusted to normalized, and the number comes apart. Management consulting fees labeled “one-time.” An owner salary replaced at half market rate. Cost savings from a vendor contract not yet signed. Pro forma synergies from an acquisition that closed two weeks before the measurement date. Strip out what can’t be defended, and the defensible earnings base is $8.7 million. Your 4.5x deal just became 6.4x, and you almost didn’t know.
This is not a hypothetical. It is the most consequential underwriting risk in middle-market direct lending today. As competitive pressure mounts and dry powder accumulates across the private credit ecosystem, EBITDA definitions are being stretched in ways that mask true leverage and suppress early warning signals. The lender who cannot reconstruct a rigorous, evidence-backed earnings base before committing capital is not underwriting; they are speculating.
This article teaches the full normalization methodology: how to build the EBITDA bridge, which add-backs survive scrutiny, how to stress-test the number, and what the current credit environment tells us about the cost of getting it wrong.
The Analytical Framework: Building the EBITDA Bridge
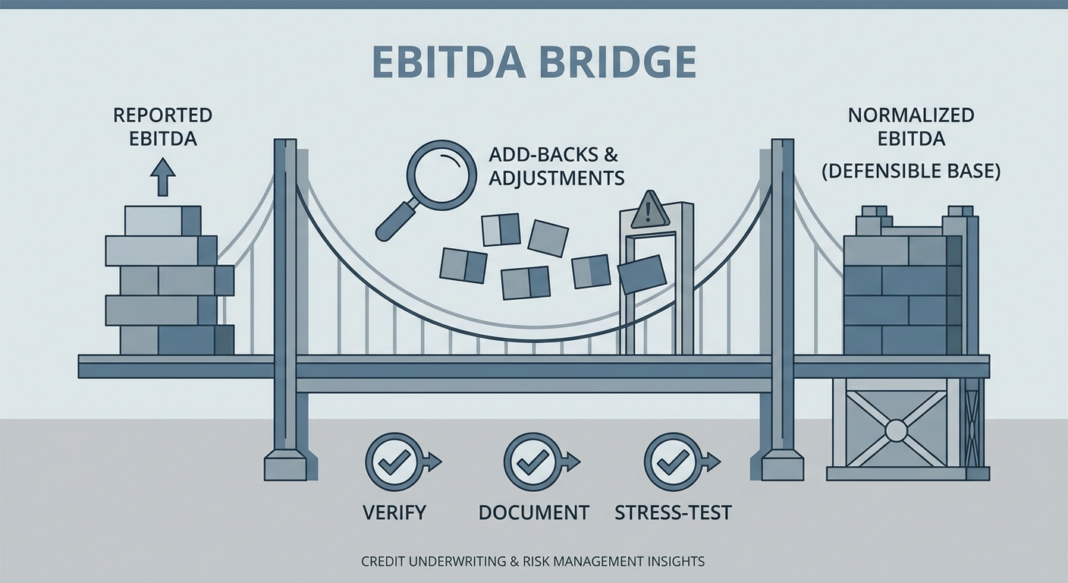
The normalization process is not a single calculation. It is a structured interrogation of earnings quality, conducted across a three-stage bridge:
Stage 1, Reported EBITDA: Start with audited or reviewed financials. Compute EBITDA from net income by adding back interest, taxes, depreciation, and amortization. This is your uncontested baseline.
Stage 2, Adjusted EBITDA: Apply add-backs that lenders and borrowers negotiate into the credit agreement. These include non-cash charges (impairment, stock-based compensation), one-time legal or transaction costs, and restructuring charges. As Haynes Boone has noted in its credit financing practice guidance, adjusted EBITDA “goes beyond traditional EBITDA by accounting for certain expenses or income items not considered representative of ongoing operational performance.”
Stage 3, Normalized EBITDA: This is the number lenders should actually underwrite. It is the sustainable, recurring subset of adjusted EBITDA: after eliminating add-backs that are not verifiable, not truly non-recurring, or that require future execution risk to materialize. As one practitioner framework describes it, normalized EBITDA is “a defensible estimate of a company’s sustainable, recurring operating earnings, adjusted to remove non-recurring, non-operating, and owner-specific items while reflecting a supportable run-rate.”
The Quality of Earnings (QoE) report, typically prepared by an independent accounting firm, is the primary tool for validating this bridge. It reconciles the EBITDA journey from GAAP reported results through to general ledger cash, tests revenue quality, and examines reserve and working capital policies.
Worked Example: $10M EBITDA Manufacturing Company
| Line Item | Amount ($000) | Lender Verdict |
|---|---|---|
| Reported Net Income | $3,200 | ✓ Anchor |
| + D&A | $2,800 | ✓ Standard |
| + Interest Expense | $1,400 | ✓ Standard |
| + Taxes | $900 | ✓ Standard |
| = Reported EBITDA | $8,300 | |
| + One-time legal settlement | $400 | ✓ Verifiable, documented |
| + Owner compensation above market | $600 | ⚠ Verify replacement cost |
| + “One-time” consulting fees | $500 | ✗ 3-year pattern; recurring |
| + Cost savings (vendor renegotiation) | $400 | ✗ No signed contract |
| + Pro forma acquisition EBITDA | $800 | ⚠ Partial credit if <30 days |
| = Defensible Normalized EBITDA | ~$9,500 | Underwriting Base |
Illustrative example only. All figures are hypothetical for teaching purposes.
The $900K delta between the sponsor’s presented number and the defensible base may seem modest, but at a 5.0x leverage multiple, it changes your maximum debt capacity by $4.5 million and shifts your entry leverage ratio materially. At 4.5x on $10.4M adjusted EBITDA (sponsor view), total debt is $46.8M. At 4.5x on $9.5M (lender view), it is $42.75M. That gap is not rounding error; it is capital at risk.
The Analysis: Walking Through Add-Back Scrutiny
Not all add-backs are equal. Experienced credit underwriters apply a tiered framework to evaluate each adjustment:
Green-Light Add-Backs (Accept with Documentation)
- Non-market owner compensation (documented with comp benchmarking study)
- Litigation settlements with court records and non-recurrence evidence
- Duplicate vendor costs post-system migration
- One-time transaction advisory fees (verify no repeat pattern)
- Impairment charges tied to discontinued business lines
Yellow-Light Add-Backs (Discount or Require Evidence)
- Management consulting fees without defined project scope and end dates
- Vendor renegotiation savings without executed contracts
- Pro forma adjustments for recent acquisitions (apply haircut for integration risk)
- Growth hires treated as add-backs rather than investment
Red-Light Add-Backs (Reject)
- Evergreen or recurring consulting that returns every year under different labels
- Structural overhead that will reappear post-close under new ownership
- Revenue-side adjustments without signed customer contracts
- Synergies requiring future execution the borrower has never attempted
The cash flow reconciliation test is your final arbiter. If adjusted EBITDA trends upward but operating cash flow does not follow, something is wrong. As practitioner guidance notes, “if EBITDA goes up but the company isn’t bringing in more cash from its regular operations, that could mean the improved earnings are just on paper”, from accounting changes or timing differences rather than real growth.
Stress-Testing the Normalized Base
After establishing the normalized EBITDA, build three scenarios:
- Base Case: Normalized EBITDA held flat for Year 1, modest organic growth thereafter
- Downside Case: 15–20% EBITDA haircut reflecting revenue loss, input cost pressure, or customer concentration risk
- Severe Stress: 30–35% haircut, testing whether debt service coverage holds above 1.0x and whether maintenance covenant headroom survives
Key metrics to track across all scenarios: Total Debt / EBITDA, EBITDA / Interest Expense (coverage ratio), Free Cash Flow / Total Debt Service, and Liquidity (revolving credit availability + unrestricted cash).
Industry Standards: What the Data Says About EBITDA Risk
The consequences of EBITDA inflation are not theoretical; they are visible in current default and restructuring patterns across the credit market.
📊 Credit Performance Data Box
- Leveraged Loan Default Rate: Moody’s projected the U.S. leveraged loan default rate to reach 7.5% by end-2025, rising to 7.9% in Q1 2026, nearly double the 3.4% historical average. (Source: Moody’s Credit Strategy, July 2025)
- Private Credit Defaults: U.S. private credit defaults rose to 5.5% in Q2 2025, up from 4.5% in Q1, reflecting stress in privately placed corporate debt. (Source: CoinLaw Corporate Bond Default Statistics, 2025)
- EBITDA Add-Back Accuracy: The Financial Stability Board, citing S&P Global Ratings research, noted that aggressive EBITDA adjustments may mean that “typical ‘true’ leverage in private credit could be closer to 7x debt-to-EBITDA” versus what reported figures suggest. (Source: FSB Report on Vulnerabilities in Private Credit, May 2026)
- Recovery Rates, First Lien vs. Cov-Lite: S&P data showed U.S. first-lien covenant-lite loans had a median recovery rate of 63.5% over 2015–2017, compared to 84.1% for non-covenant-lite institutional syndicated loans. (Source: FSB/S&P Leveraged Lending Study)
- Distressed Exchanges: Distressed exchanges accounted for 64% of all defaults in the first half of 2025, approximately the same pace as all of 2024, itself the highest annual share on record. Many of these events are rooted in original underwriting that accepted inflated earnings bases. (Source: Moody’s Credit Strategy, July 2025)
- PIK Income Signal: In the direct-lending market, payment-in-kind (PIK) income reached approximately 8.8% in Q3 2025, up from roughly 4.2% pre-pandemic, a level that has historically coincided with borrowers seeking to conserve cash. (Source: Vanguard Institutional Research, February 2026)
- Defaults by Borrower Size: Defaults in private credit have been most concentrated among companies with $25–$50M EBITDA, suggesting mid-range borrowers carry elevated normalization risk. (Source: J.P. Morgan Private Bank, March 2025)
Common Underwriting Mistakes
Vanguard’s institutional research identified a critical pattern: “competitive pressures may show up first in greater leverage, looser covenants, more aggressive adjustments to EBITDA, and broader flexibility provisions, rather than in near-term default rates.” This lag effect is dangerous. A cohort of 2021–2022 vintage loans with inflated earnings bases did not default immediately; they defaulted in 2024–2025 when interest rates rose and margin compression arrived simultaneously.
Buyers in today’s deal environment are demanding higher standards: they want EBITDA to “connect directly to sustainable free cash flow and demonstrated cost savings that reflect business reality.” Lenders who accepted headline numbers without reconciling to operating cash flow are now managing those workouts.
EBITDA Normalization Underwriting Checklist
Use this checklist at the pre-commitment diligence stage for every sponsored and non-sponsored credit:
Documentation Requirements
- ✅ 3 years of audited or reviewed financial statements (GAAP or GAAP-equivalent)
- ✅ Month-by-month management accounts for the trailing 12 months (TTM)
- ✅ Quality of Earnings (QoE) report from an independent accounting firm
- ✅ EBITDA bridge schedule from borrower, reconciled line-by-line to GL
- ✅ Supporting documentation for each claimed add-back (>$50K threshold)
- ✅ Customer and revenue concentration analysis (top 10 customers as % of revenue)
Questions to Ask Every Borrower
- ❓ Has this “one-time” cost appeared in any prior year’s financials? (If yes: reject the add-back)
- ❓ Is the replacement cost for owner compensation based on an actual market benchmark?
- ❓ Are identified cost savings supported by executed vendor contracts or board approvals?
- ❓ Does operating cash flow over the last 3 years correlate with stated EBITDA trends?
- ❓ What is the working capital cycle, and have reserves been tested against AR aging?
- ❓ Has the company used PIK or deferred interest arrangements in the last 24 months?
Stress-Test Protocol
- ✅ Run downside EBITDA at −20% and confirm DSCR remains ≥1.1x
- ✅ Confirm leverage at entry does not exceed 6.0x on normalized (not adjusted) EBITDA
- ✅ Size the revolving credit facility to cover at least 90 days of fixed charges
- ✅ Set maintenance covenant with 20–25% headroom over normalized base case
- ✅ Flag any deal where EBITDA add-backs exceed 20% of reported EBITDA for senior credit committee review
Key Takeaways
- 📌 The EBITDA bridge is the underwriting foundation. Every dollar of add-back must be independently verified, documented, and tested for recurrence before it enters your leverage calculation. Lenders who skip this step inherit the sponsor’s risk without the sponsor’s upside.
- 📌 Cash flow is the ultimate arbiter. If operating cash flow diverges from stated EBITDA trends over a multi-year period, the earnings base is suspect, regardless of how clean the adjustments appear in the CIM.
- 📌 The current credit cycle punishes EBITDA inflation with a lag. Moody’s data shows leveraged loan default rates running nearly double their historical average, with distressed exchanges reaching record share. Many of these events trace back to 2021–2022 vintage deals underwritten on inflated earnings bases during peak competition.
- 📌 Covenant structure must be anchored to normalized, not adjusted, EBITDA. A maintenance covenant calibrated to an inflated earnings base provides no early warning. Set it to normalized EBITDA with sufficient headroom to trigger before the borrower is in free fall.
- 📌 Underwriting discipline is a competitive differentiator, not a constraint. In a market where PIK income is rising, defaults are concentrated in the $25–$50M EBITDA cohort, and regulatory bodies are flagging EBITDA manipulation as a systemic vulnerability, lenders who maintain rigorous normalization standards will compound better (and suffer fewer workouts) than those who chase paper yield.


