
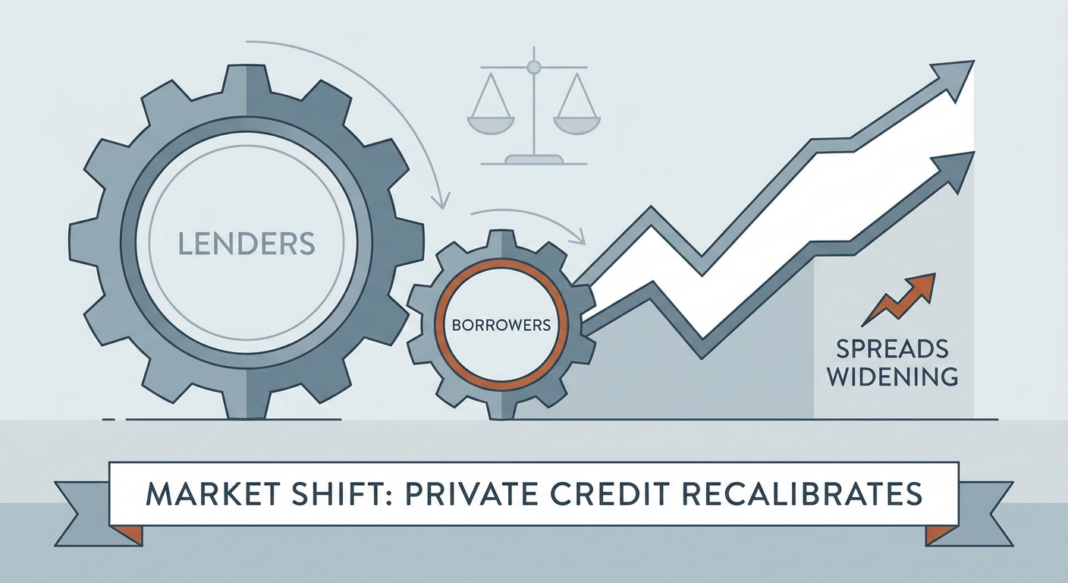
The Turn: Private Credit Pricing Power Shifts Back to Lenders
For the first time since the post-COVID tightening cycle, the structural forces that held private credit spreads near decade lows for most of 2025 are reversing in a meaningful and potentially durable way. As of mid-May 2026, market participants across direct lending, Business Development Companies (BDCs), and broadly syndicated loan (BSL) markets are reporting measurable spread widening, not as a one-off dislocation, but as the early expression of a deeper supply/demand recalibration in private capital markets.
The catalyst is multi-layered. Redemption pressure at non-traded BDCs and semi-liquid interval funds has tightened vehicle-level liquidity, removing a key source of aggressive new-money competition. Simultaneously, AI disruption risk is prompting lenders to apply more selective underwriting in the software sector, historically one of the most lender-favored verticals in middle-market direct lending. Meanwhile, the FOMC’s pause on rate cuts in 2026, sustained geopolitical volatility from the Middle East conflict, and an elevated Fitch-reported default rate of 5.4% as of February 2026 are all converging to tighten the window for lower-quality borrowers seeking to refinance ahead of maturity walls.
The Q1 2026 private lending market nonetheless recorded its strongest Q1 on record, with combined originations reaching $29.7 billion: up 4.0% year-over-year, underscoring that capital availability has not disappeared, but its terms are becoming materially more lender-friendly. Operators and institutional investors who misread this shift as transitory do so at their own risk.
Quantitative Market Snapshot: Rates, Spreads & KPI Benchmarks
The table below captures the most current pricing and structural data across public and private credit markets, providing a baseline for underwriting assumptions and portfolio benchmarking as of Q1–Q2 2026.
| Metric | Current Value (Q1–Q2 2026) | Prior Period | Source |
|---|---|---|---|
| Avg. First-Lien Middle Market Direct Lending Spread | ~S+500 bps (Q4 2025 base; moving toward S+550 in Q2 2026) | S+450–499 (majority of 2025 deals) | crisil.com / yahoo.com (LCD) |
| Unitranche Spread (First-Lien Equivalent) | 508 bps (Q4 2025) | Sub-500 bps for much of mid-2025 | crisil.com |
| Avg. First-Lien All-In Yield (Middle Market) | 9.16% (Q4 2025) | ~10%+ in 2024 (higher base rate) | crisil.com |
| SOFR (Base Rate) | 3.65% (April 6, 2026) | 4.33% (April 2025) | crisil.com |
| BSL BB/BB- Term Loan Spread (30-day avg. to Mar 12, 2026) | S+241 bps | ~S+191 bps (January 2026 lows) | yahoo.com (LCD) |
| BSL B/B+ Term Loan Spread (30-day avg. to Mar 12, 2026) | S+379 bps | ~S+279 bps (January 2026 lows) | yahoo.com (LCD) |
| Fitch US Private Credit Default Rate | 5.4% (February 2026) | Elevated vs. pre-2024 baseline | crisil.com |
| Private Lender Total Origination Volume (Q1 2026) | $29.7 billion (+4.0% YoY) | $28.6B (Q1 2025) | sfranalytics.com |
| KBRA Middle Market Default Rate (Q4 2025) | 2.0% by value / 3.4% by count | Below Fitch proxy; downgrades outpacing upgrades for 8 straight quarters | crisil.com |
The FCCR and leverage multiple picture is tightening in tandem. With all-in yields still at 9.16% and SOFR-driven relief partially offset by widening credit spreads, borrowers in the $20M–$75M EBITDA range face meaningfully higher debt service burdens on new originations in Q2 2026 than they did six months ago. Lenders are reporting greater scrutiny of coverage ratios, with minimum FCCR thresholds trending upward in credit agreements and leverage multiples being held steady or trimmed selectively in cyclical sectors.
Sector Analysis: Where Capital Is Flowing, and Where It Is Tightening
🔴 Software & Technology: Caution Flags Rising
Software (once the crown jewel of private credit underwriting due to its recurring revenue, high margins, and low capital intensity) is facing a structural reassessment. crisil.com notes that KBRA’s March 2026 research shows lenders are already tightening terms more selectively where AI disruption risk is assessed to be higher. The concern is real: AI-native competitors are compressing the moats of established SaaS companies, clouding retention and net revenue retention (NRR) assumptions that underpinned much of the aggressive SaaS underwriting of 2021–2024. Expect documentation packages and covenant packages in software deals to grow more restrictive through H2 2026.
🟡 Real Estate (RTL vs. DSCR Divergence): A Tale of Two Products
Q1 2026 private lending data from sfranalytics.com reveals a sharp internal divergence in real estate credit. Residential Transition Loans (RTL) surged +13.0% YoY to approximately $19B, driven by demand for transitional and value-add execution as investors pursue forced appreciation strategies. Meanwhile, Debt-Service Coverage Ratio (DSCR) loans contracted -8.8% YoY to $10.7B, as buy-and-hold investors stay on the sidelines waiting for cap rate expansion. RTL rates remain elevated at 9.5–11%, while DSCR rates hold a tight median of 7.0%: with 90% of loans falling within the 6–8% corridor. Florida stands out as a risk concentration zone, accounting for 7 of the top 10 markets for pre-foreclosure activity, with the national pre-foreclosure rate at 1.10% of outstanding private lender loans.
🟢 M&A-Backed Leveraged Finance: Resilient but Selective
Across the broadly syndicated market, M&A-backed institutional loan volume reached $74.6 billion in Q1 2026: the highest level since Q1 2022’s $94.4B, representing 46.0% of total institutional loan volume, per kpmg.com. Total leveraged loan issuance reached $173.3B, up from $138.1B in Q4 2025, though down from $195.1B in Q1 2025. The M&A pipeline is sustaining credit market activity even as refinancing activity decelerates, the refi share fell to 37% of institutional loan volume, down from 49% in Q1 2025. High-yield issuance continues to benefit from AI/data-center-related CapEx demand.
🟠 Midwest & Sunbelt (Ex-Florida) Real Estate: Geographic Divergence
Sub-regionally, the Midwest and North Carolina posted the strongest YoY growth in private lending activity in Q1 2026, per sfranalytics.com, reflecting still-favorable affordability dynamics and persistent housing supply gaps. Three of the ten worst-performing major markets were in Florida, reflecting the convergence of insurance cost escalation, HOA stress, and investor oversupply in select submarkets.
Implications for Institutional Investors & Operators
For Borrowers
The repricing window is narrowing. Sponsors and operators who have not yet addressed near-term maturities, particularly B- and lower-rated borrowers flagged by kpmg.com as carrying the heaviest near-term rollover burden, face a materially more expensive refinancing environment in H2 2026. The shift from S+450 to S+500–550 on new originations translates directly to FCCR compression. A business with a 1.25x FCCR at S+450 may fall to sub-1.15x at S+550 absent EBITDA growth, triggering covenant violations or lender-driven restructuring conversations. Proactive engagement with existing lenders on amend-and-extend structures, PIK toggle mechanisms, or incremental liquidity facilities is now a strategic priority, not a contingency plan.
For Lenders & Institutional Investors
The current environment favors lenders with deep restructuring and liability management capabilities over pure growth underwriters. As crisil.com observes, the next 24–36 months are likely to reward those who can distinguish a refinanceable credit from a deferrable problem. PIK remains a key monitoring variable, Lincoln International reported that 11% of loans carried some PIK in 2025, with 58% of that PIK classified as ‘bad’ (i.e., distress-driven rather than structural). With Moody’s having revised its outlook on US BDCs to negative on April 7, 2026, citing redemption pressure and higher leverage, allocators to BDC and non-traded credit vehicles should conduct fresh liquidity stress tests on their fund-level exposures. The spread widening itself creates opportunity: investors entering new direct lending commitments today at S+500–550 are locking in better risk-adjusted terms than any point in the past 24 months.
Forward-Looking View: Next 3–6 Months
The base case is for continued, gradual spread widening through Q3 2026, with new-issue middle-market direct lending pricing drifting toward S+525–575 for non-cyclical credits and wider still for sectors facing structural headwinds. The FOMC pause removes the base-rate relief tailwind that cushioned 2025’s compressed spread environment. Geopolitical oil price volatility introduces an upside inflation risk that could force rate increases, a scenario that would sharply accelerate credit tightening across all but the highest-quality borrowers. The M&A pipeline remains the primary countervailing force: if deal activity holds at or above Q1 2026 levels, deal flow will sustain credit market activity even as terms tighten. Operators and lenders alike should plan for a mid-cycle inflection, not a crisis, but the margin for underwriting error is shrinking.
Key Market Insights
- Spread widening is real and accelerating: Survey data shows the share of respondents expecting a plain-vanilla $50M EBITDA business to price at S+550 or higher jumped from 6% in Q4 2025 to 33% in Q1 2026, marking a decisive shift in market pricing expectations. (yahoo.com/LCD)
- BDC liquidity stress is a structural catalyst: Elevated redemption requests at non-traded BDCs and interval funds are reducing competition among lenders, directly contributing to the repricing of new originations and tighter credit documentation standards. (crisil.com)
- Software underwriting faces a structural reckoning: AI disruption risk is prompting selective covenant tightening in software-sector deals, a significant shift from the sector’s status as private credit’s most favored vertical for the past five years. (crisil.com)
- Real estate private credit is bifurcating sharply: RTL volume surged +13% YoY while DSCR contracted -8.8% YoY in Q1 2026, reflecting value-add capital rotation and buy-and-hold investor caution, a divergence that is likely to persist as long as cap rate uncertainty remains elevated. (sfranalytics.com)
- PIK and downgrade trends signal late-cycle credit stress: With downgrades outpacing upgrades for eight consecutive quarters, Fitch’s 5.4% default rate, and 11% of loans carrying some PIK in 2025, the credit cycle is entering a phase that demands granular portfolio monitoring and proactive liability management over passive hold strategies. (crisil.com)


