
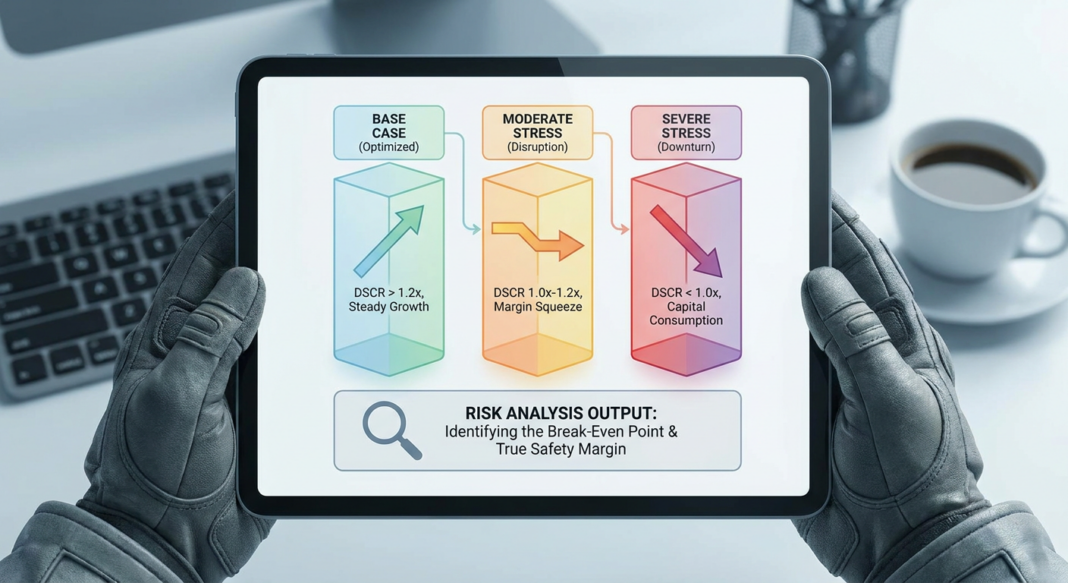
The Underwriting Challenge: When the Base Case Is Not the Risk Case
Every credit memo presents a base case. Management projects 8% revenue growth. EBITDA margins hold steady. Working capital behaves. The debt gets repaid on schedule. But lenders do not lose money in base cases; they lose money in downturns, operational disruptions, and margin compression events that no sponsor modeled in the pitch deck.
The central discipline of credit underwriting is not validating the borrower’s optimism. It is asking a harder question: How much can this business deteriorate before it can no longer service its debt? The answer lives inside a properly constructed cash flow stress test, a structured scenario analysis that peels back the base case and reveals the true margin of safety embedded in a proposed loan structure.
For middle market private lenders, where financial reporting is less frequent, covenants carry more protective weight, and secondary liquidity is thin, stress testing is not a regulatory checkbox. It is the primary tool for distinguishing a sound credit from a fragile one dressed up in a healthy trailing EBITDA figure.
The Analytical Framework: Building a Credible Stress Architecture
A rigorous cash flow stress test is built on three structural pillars: revenue sensitivity, margin compression, and fixed charge coverage under duress. Each pillar must be modeled independently and then in combination, because the most damaging credit scenarios are rarely single-variable events.
Step 1: Establish the Normalized EBITDA Base
Before stressing anything, the underwriter must be confident the starting EBITDA figure is real. That means scrubbing management addbacks, removing one-time items that recur in practice, and adjusting for run-rate cost structures. Fitch’s corporate rating methodology explicitly evaluates EBITDA-based profitability and leverage ratios as central credit metrics, cross-referencing historical performance with forward projections over a three-to-five year horizon to capture at least one full economic cycle, a standard that private lenders should mirror internally. (See fitchratings.com.)
Example: A $12M reported EBITDA manufacturing company has $1.8M in addbacks: restructuring costs, one-time legal fees, and a CEO transition bonus. After scrutiny, $900K of those addbacks are arguably recurring in nature (annual legal costs and recurring severance patterns). Normalized EBITDA: $11.1M. That $900K difference changes leverage from 4.5x to 4.9x on a $50M debt package, a material distinction in underwriting terms.
Step 2: Define Scenario Parameters
Construct at least three stress scenarios beyond base case:
- Mild Stress (S1): Revenue declines 10%, EBITDA margins contract 150bps due to fixed cost absorption. Approximates a mild demand softening or single customer loss.
- Moderate Stress (S2): Revenue declines 20%, margins contract 300bps, capex increases 15% due to deferred maintenance catch-up. Approximates a sector-specific recession or meaningful competitive disruption.
- Severe Stress (S3): Revenue declines 30–35%, margins compress 500bps, working capital deteriorates as receivables age and inventory builds. Approximates a 2008-style demand shock or COVID-equivalent operational freeze.
Moody’s framework for rating finance companies incorporates explicit stress testing of debt maturity coverage and funds-from-operations-to-debt ratios under adverse scenarios, a methodology that translates directly into how private lenders should frame their own scenario architecture. (See ratings.moodys.com.)
Walking Through the Calculations: From EBITDA to Free Cash Flow Under Stress
Using the manufacturing example ($11.1M normalized EBITDA, $50M total debt at 7.5% all-in rate, 5-year term with 1% annual amortization), here is how each stress scenario flows through to debt service coverage:
| Metric | Base Case | S1, Mild | S2, Moderate | S3, Severe |
|---|---|---|---|---|
| Stressed EBITDA | $11.1M | $9.6M | $7.8M | $5.4M |
| Less: Cash Taxes & Capex | ($1.5M) | ($1.5M) | ($1.7M) | ($2.0M) |
| Free Cash Flow (pre-debt service) | $9.6M | $8.1M | $6.1M | $3.4M |
| Annual Debt Service (interest + amortization) | $4.25M | $4.25M | $4.25M | $4.25M |
| DSCR | 2.26x | 1.91x | 1.44x | 0.80x |
| Total Leverage (Debt / Stressed EBITDA) | 4.5x | 5.2x | 6.4x | 9.3x |
The S3 scenario exposes the structural weakness: a DSCR below 1.0x means the borrower cannot cover debt service from operations. Leverage climbing to 9.3x under severe stress signals that recovery would depend heavily on collateral, which is why asset-level analysis must accompany every cash flow model. As ARC Ratings notes in its CLO criteria, recovery rate assumptions must account for jurisdiction, debt seniority, and the volume of pledged assets already encumbering the borrower’s balance sheet. (See arcratings.com.)
What Institutional Lenders Look For, and Where Deals Break Down
Experienced direct lenders typically require a minimum base-case DSCR of 1.20x–1.35x and a stressed DSCR (S1/S2) above 1.0x before committing to a senior secured position. PGIM’s large-cap private credit framework highlights that larger borrowers with stronger revenue growth, more resilient margins, and experienced management teams have historically produced lower default rates and higher recovery rates than their smaller counterparts, underscoring why scale and margin durability are critical stress inputs, not afterthoughts. (See pgim.com.)
Common Red Flags in Cash Flow Stress Reviews
- Thin S1 cushion: If mild stress (10% revenue decline) already compresses DSCR below 1.25x, the base case is not sufficiently protected. The covenant package carries too much weight.
- Fixed-cost rigidity: Businesses with high operating leverage (labor-heavy models, long-term lease commitments, union contracts) deteriorate faster than variable-cost models under revenue stress. Identify fixed vs. variable cost split before building scenarios.
- Working capital traps: In a downturn, receivables extend and inventory builds, consuming the very cash the borrower needs for debt service. A stress test that ignores working capital dynamics is structurally incomplete.
- Addback-inflated entry leverage: A borrower entering at 5.5x stated leverage but 6.2x on a quality-of-earnings-adjusted basis has almost no stress buffer before covenants breach or payment capacity erodes.
- Single-customer concentration: Revenue stress scenarios must be calibrated to the borrower’s actual customer concentration. A 20% top-customer loss is not a tail event; it is a plausible single-name scenario.
- Fitch’s corporate rating criteria use a three-to-five year projection horizon combined with at least three years of operating history as the standard analytical window for credit assessment. (fitchratings.com)
- Moody’s finance company scorecard explicitly weights FFO-to-Total-Debt and Secured-Debt-to-Gross-Tangible-Assets as key financial profile sub-factors in credit assessment. (ratings.moodys.com)
- ARC Ratings notes that a typical recovery proceeds lag for defaulted corporate loans in developed markets is 12–18 months post-default, a timeline that directly affects the lender’s liquidity exposure during workout. (arcratings.com)
- PGIM research indicates that large-cap private credit borrowers (EBITDA > $75M) have historically produced lower default incidence and stronger recovery outcomes than smaller borrowers, tied to greater operational scale and documentation quality. (pgim.com)
Cash Flow Stress Testing Underwriting Checklist
- Normalize EBITDA: Scrub all addbacks. Reclassify recurring items. Confirm quality-of-earnings adjustments with third-party QoE report where deal size warrants.
- Map fixed vs. variable costs: Request a detailed cost bridge from management. Identify which costs are contractually fixed vs. operationally variable under a revenue decline scenario.
- Build three independent stress scenarios (S1, S2, S3) with explicit revenue decline, margin compression, and capex assumptions for each. Do not average, run each independently.
- Model working capital changes under stress: Apply DSO and DIO expansion assumptions in S2 and S3. Calculate the cash drag separately from EBITDA deterioration.
- Calculate DSCR and leverage at each scenario: Confirm that S1 maintains DSCR > 1.0x. Identify at what revenue decline level debt service becomes impaired.
- Test covenant headroom: Map the financial covenant threshold (e.g., maximum leverage of 5.5x) against stressed leverage at each scenario. Confirm sufficient buffer before breach triggers a default.
- Assess recovery position under S3: If cash flow coverage fails under severe stress, shift analysis to collateral value. Confirm first-lien position, appraise asset values independently, and apply stressed recovery haircuts consistent with asset type and jurisdiction.
- Document the break-even revenue decline: State explicitly in the credit memo the percentage revenue decline at which DSCR falls below 1.0x. This single figure distills the margin of safety for the credit committee.
- Validate with comparable credit data: Reference industry-specific default and recovery data from Moody’s, Fitch, or S&P to benchmark the borrower’s stress resilience against sector peers.
- Review with management: Present the S2 scenario to management and document their operational response plan. A credible management team should have a rehearsed playbook for revenue decline, the absence of one is itself a risk signal.
Key Takeaways
- The base case is not a risk management tool. Stress testing begins where management projections end. Build your scenarios from normalized, QoE-adjusted EBITDA, not reported figures.
- DSCR is the anchor metric, not leverage alone. A borrower at 5.0x leverage with a 2.1x DSCR is structurally safer than one at 4.0x leverage with a 1.15x DSCR. Coverage tells the cash flow story leverage cannot.
- Working capital is the hidden stress amplifier. Every severe downturn consumes cash through receivables extension and inventory build before it ever shows up in EBITDA. Model it explicitly, every time.
- Recovery analysis is not optional in S3. When cash flow fails under severe stress, the lender’s protection shifts to collateral. Knowing the recovery value (and the 12–18 month lag to realize it) is essential to pricing and structuring decisions.
- Document the break-even clearly. The single most useful output of a stress test is the revenue decline percentage at which debt service becomes impaired. Every credit memo should state this number explicitly for the credit committee’s reference.


