
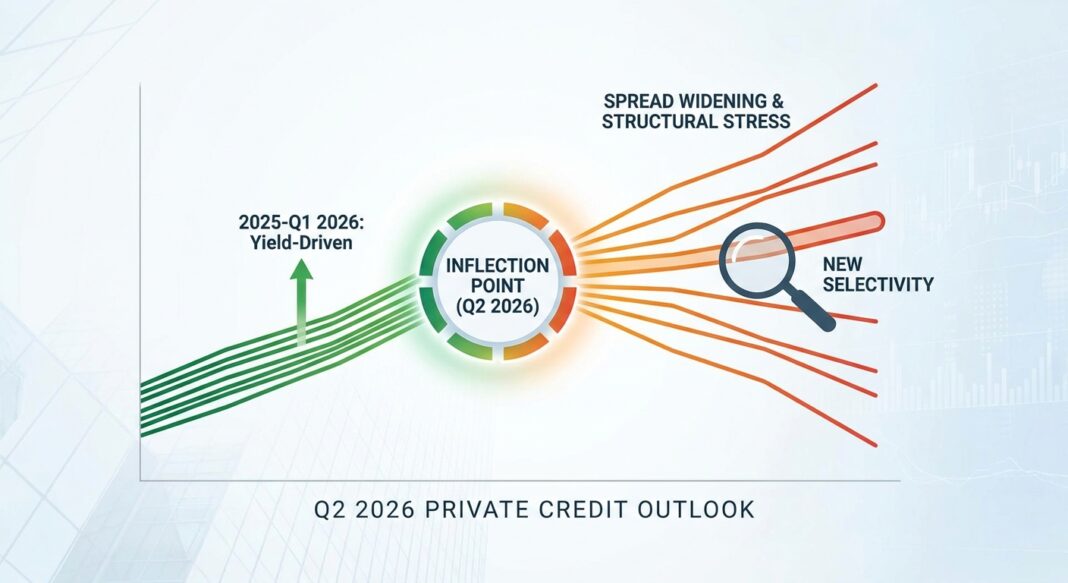
The Macro Story: From Yield-Driven Growth to Structure-Driven Selectivity
The defining credit market story of Q2 2026 is not a crisis; it is a reckoning. Private credit, which has grown from roughly 1% of U.S. nominal GDP in 2008 to approximately 6% today (~$1.8 trillion globally), is undergoing its most consequential repricing since the post-GFC expansion began. The catalyst is not a single shock but a convergence: benchmark volatility triggered by the April 2 tariff announcement that pushed the 10-year Treasury from sub-4.00% in late February to above 4.30% within days; a software-sector equity selloff of ~22% since January that has mechanically widened loan-to-enterprise-value ratios on private credit books; and a structural liquidity mismatch inside wealth-channel vehicles that has produced visible redemption gates at several of the largest semi-liquid funds. The market is not broken. Capital remains available across every institutional channel. What is in short supply, as John Morelli’s April CRE Debt Market Sentiment report puts it, is “the willingness to price and commit in a benchmark that will not hold still.”
The Federal Reserve, with the funds rate anchored at 3.50%–3.75% and incoming Chair Warsh signaling a hawkish hold, has effectively removed the rate-cut tailwind borrowers anticipated entering the year. The result is a market where lenders quote wide and close selectively, where execution certainty commands a premium over marginal rate improvements, and where selectivity, not capital scarcity, is the defining constraint on deal flow.
Quantitative Market Snapshot
| Metric | Current (Q2 2026) | Prior Period | Direction | Source |
|---|---|---|---|---|
| Debt Fund / Private Credit Spreads (CRE) | 250–430 bps + SOFR | 245–415 bps + SOFR (Feb 2026) | ↑ Widening | johnmorelli.us |
| IG Corporate Bond OAS | +89 bps (end Q1 2026) | +78 bps (Jan 2026 tightest in 20 yrs) | ↑ Widening | breckinridge.com |
| U.S. Private Credit Default Rate | 9.2% (2025, record high) | 8.1% (2024) | ↑ Worsening | atlaspeakresearch.com (citing Fitch) |
| Listed BDC Price / Reported NAV | ~$0.78 on the dollar (Mar 12, 2026) | ~$0.85 (Jan 2026); ~par (early 2025) | ↓ Deteriorating | atlaspeakresearch.com |
| 10-Year U.S. Treasury Yield | 4.25%–4.35% range (Apr 2026) | ~3.93% (late Feb 2026) | ↑ Bear Steepening | johnmorelli.us |
| Leveraged Loan Total Issuance (Q1 2026) | ~$241B (incl. repricings) | Running 32% below Q1 2025 pace | ↓ Declining | sikich.com |
| Software Borrower Avg. Leverage Multiple | 7.4x EBITDA | 5.9x (broader loan pool) | ⚠ Elevated Risk | atlaspeakresearch.com (citing KBRA) |
Sector Analysis: Hot, Cold, and Structurally Shifting
Technology / Software, Significant Stress. Software has become the clearest fault line in private credit. Per Atlas Peak Research citing Morgan Stanley and KBRA, software represents ~16% (~$235B) of the $1.5 trillion U.S. loan market, with approximately 50% of software loans rated B- or lower, and average borrower leverage at 7.4x EBITDA versus 5.9x for the broader pool. A 22% equity-market selloff since January has pushed loan-to-enterprise-value ratios materially higher. Lenders are tightening underwriting, reducing leverage multiples, and demanding tighter covenants on new software originations. The near-term default risk is not expected to spike sharply, but spread widening, tougher refinancing terms, and progressive mark pressure are the most likely trajectory.
Multifamily / CRE, Selective Execution. Agency capacity for 2026 has expanded significantly, with the combined GSE cap set at $176 billion, a 20.5% increase over 2025, and both Fannie Mae and Freddie Mac actively competing for qualified volume, per John Morelli. However, post-2021 vintage multifamily assets underwritten at compressed cap rates face DSCR compression from expense inflation in insurance, taxes, and payroll. Life companies are active on stabilized industrial, anchored retail, and Class A multifamily with LTV thresholds holding at 55%–65%. Banks remain relationship-focused; new origination appetite for non-relationship CRE is subdued.
Office, Bifurcated and Under Pressure. CMBS office delinquency hit a cycle high of 12.34% in January 2026 before a slight retreat, with office property values down more than 55% from issuance values in the distressed segment. Over $100 billion in CMBS loans mature in 2026, with office representing a disproportionate share. Trophy and Class A assets in select gateway markets are seeing renewed investor appetite (recent SASB issuance has included Midtown Manhattan and Sunbelt office) but underwriting standards are tight, recourse requirements are common, and conservative leverage is the expectation.
Industrial, Moderating but Fundamentally Sound. Large-format logistics is facing demand softening driven by inventory normalization and tariff-related occupier caution. Sub-100,000 sq. ft. industrial continues to perform, with sale prices rising nearly 11% through 2025. Lender appetite across capital sources remains strong, though tenant credit, lease duration, and trade-sensitive occupier exposure are under closer scrutiny than a year ago.
Asset-Backed / Infrastructure Credit, Growing Structural Appeal. As Cresset Capital notes, asset-backed segments (equipment leasing, infrastructure cash flows, and royalty streams) are attracting increased institutional attention for their collateral clarity, reduced mark-to-model subjectivity, and favorable tax treatment. The restoration of full bonus depreciation under recent tax policy changes reinforces after-tax return advantages for these structures, particularly for taxable investors.
Implications for Institutional Investors and Operators
For Borrowers: Execution certainty must be treated as the primary variable in the current environment, with rate as secondary. The 40-basis-point benchmark move over two weeks in early April is a direct illustration of the cost of waiting for rate stability. Floating-rate structures tied to SOFR offer greater near-term pricing predictability for transitional or shorter-hold assets. Borrowers with 2026 maturities (particularly in lower-rated or software-exposed books) face a narrowing refinancing window as lender patience is conditional and maturity pressure is intensifying among weaker credits. Operators should stress-test DSCR and FCCR assumptions at current debt costs without assuming further Fed relief.
For Investors and Lenders: The public market’s discount of listed BDCs to approximately $0.78 on reported NAV signals growing skepticism around mark-to-model valuations in private credit portfolios. Investors should scrutinize payment-in-kind income ratios, which FSOC notes have increased significantly since 2019 and can defer, rather than eliminate, loss recognition. Capital continues to flow, but the allocation calculus is shifting: closed-end institutional vehicles retain structural soundness, while semi-liquid wealth-channel products face ongoing redemption pressure. The $1.3 trillion in bank loans to non-bank financial institutions identified by Cresset Capital represents a real, if not immediate, contagion channel that warrants monitoring.
Forward-Looking View: Contested Patience, Selective Deployment
The next three to six months will be shaped by whether the 10-year Treasury finds a stable range and whether incoming Fed Chair Warsh provides clearer forward guidance. Until benchmark volatility subsides, fixed-rate lenders will continue to quote wide and close selectively. The structural advantages of private credit (floating-rate execution, speed, and flexibility) remain intact, but the premium for quality has risen sharply. Investors who entered the cycle early with conservative leverage are best positioned. New capital deployment will increasingly favor asset-backed structures with tangible collateral, higher-quality credits in non-software sectors, and sponsors with demonstrated operational depth. The market is not retreating. It is repricing, and in that repricing, selectivity is the new yield.


