
The Underwriting Question Every Lender Must Answer First
A $10M EBITDA specialty manufacturer approaches your desk seeking a $40M senior secured term loan to fund a sponsor-backed buyout. The leverage multiple is 4.0x: well within current mid-market norms, where total leverage typically ranges from 4.0x to 5.0x EBITDA, down from 6.0x-plus seen in the low-rate era of 2018–2019. All-in interest costs for quality mid-market credits now run 9% to 11%. The numbers look manageable on paper. But the real question isn’t whether the company can service debt today, it’s whether it can service that debt when revenue drops 20%, input costs spike, or a key customer walks. That is the discipline of cash flow stress testing, and it is the core of rigorous credit underwriting.
Stress testing is not pessimism for its own sake. It is a structured methodology for understanding where a capital structure breaks, and building in enough cushion that lenders are protected before that breaking point is reached. Institutional managers with deep workout experience consistently frame their edge around loss avoidance, not spread maximization, a principle underscored by OHA’s February 2026 Credit Investor’s Checklist, which documents that higher recovery portfolios can generate 44% more loss-adjusted spread than lower-recovery portfolios with identical nominal spreads and default rates.
The Analytical Framework: Four Layers of Cash Flow Stress
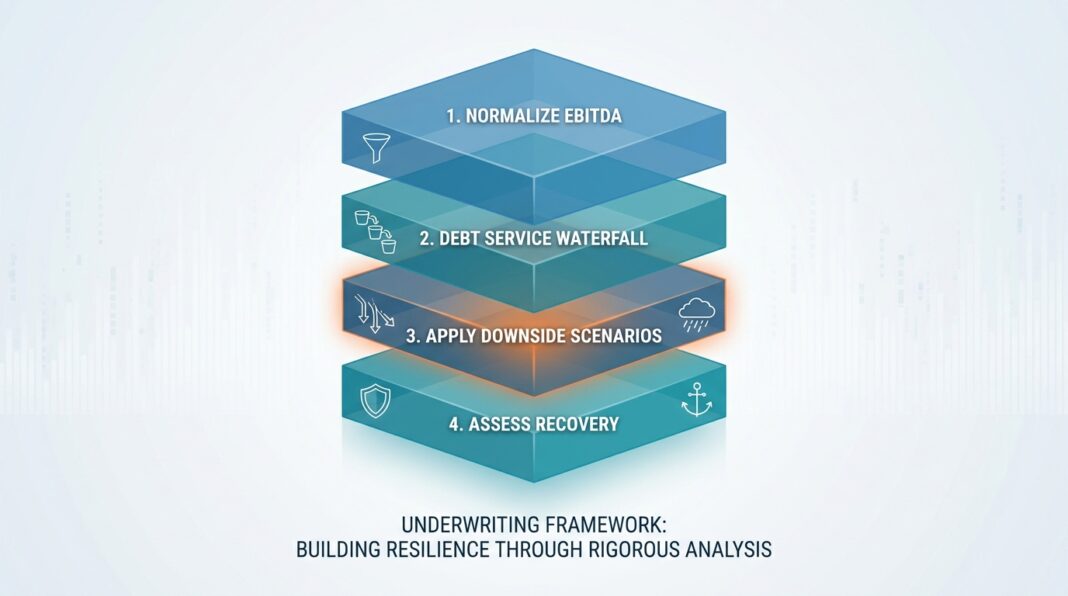
A sound stress-testing framework moves through four sequential layers, each designed to isolate a specific vulnerability in the borrower’s cash generation engine.
Layer 1: Normalize the Base Case EBITDA
Before stressing anything, you must establish a clean, defensible EBITDA figure. Strip out one-time items, management add-backs that lack clear substantiation, and any revenue from discontinued contracts. Rating agencies including Fitch Ratings anchor their quantitative credit metrics to EBITDA-based profitability, leverage, and coverage ratios precisely because EBITDA is the most direct proxy for cash flow generation relative to debt service requirements. Loose EBITDA definitions are one of the most common documentation vulnerabilities lenders face, a risk highlighted explicitly in OHA’s analysis of liability management exercises (LMEs) involving borrowers such as J. Crew and Serta.
Layer 2: Build the Debt Service Waterfall
Map every fixed obligation the borrower must satisfy before a dollar reaches equity. This includes scheduled interest, mandatory term loan amortization, maintenance capex, cash taxes, and any lease obligations. The resulting Free Cash Flow Available for Debt Service (FCFADS) is the true denominator of risk:
FCFADS = EBITDA − Taxes − Maintenance CapEx − ΔWorking Capital
For our $10M EBITDA manufacturer: assume $800K in cash taxes, $1.2M maintenance capex, and $300K average working capital build. FCFADS = $7.7M. Against $3.6M in annual interest (at 9% on $40M), the baseline Debt Service Coverage Ratio (DSCR) is approximately 2.1x: comfortably above the 1.25x minimum most institutional lenders require, and approaching the 2.0x threshold preferred for quality mid-market credits, consistent with debt capacity frameworks documented by IB Interview Questions’ LBO Debt Capacity Guide.
Layer 3: Apply Downside Scenarios
Run at least three structured scenarios against the normalized base case:
- Mild Recession: Revenue declines 10%, margins compress 150bps due to fixed-cost absorption.
- Moderate Stress: Revenue declines 20%, a key customer representing 15% of revenue is lost, input costs rise 5%.
- Severe Downside: Revenue declines 30–35%, consistent with peak-to-trough EBITDA declines observed in cyclical industrials during past recessions, combined with a working capital outflow.
In the moderate stress scenario for our manufacturer, EBITDA falls to roughly $7.2M (28% decline). After the same fixed charges, FCFADS drops to approximately $4.4M. DSCR compresses to 1.22x, breaching the 1.25x covenant floor. This is precisely where covenant design intersects with stress testing: the lender is warned by a financial maintenance trigger before a payment default occurs.
Layer 4: Assess Recovery in a Default Scenario
Even after stress scenarios, underwriting is incomplete without a recovery analysis. Moody’s Analytics RiskFrontier methodology treats Loss Given Default (LGD) as a primary input in portfolio credit risk modeling, alongside probability of default and correlation structures. For secured lenders, the collateral coverage ratio, Total Debt ÷ Appraised Collateral Value, should be stress-tested using forced liquidation values, not going-concern enterprise value.
What Institutional Lenders Are Watching in 2026
The current credit environment has made several data points particularly instructive for stress-testing calibration:
📊 Credit Performance Data Points
- Borrowers with EBITDA ≥ $100M exhibited a 32% lower default rate than smaller borrowers from 1Q 1995 through 4Q 2025, per Pitchbook LCD data cited in OHA’s Q1 2026 Credit Checklist.
- Equity contributions in current LBO structures have risen to 45%–55% of purchase price, versus 35%–40% in lower-rate environments, compressing total leverage headroom, per LBO debt capacity analysis.
- Institutional lenders generally require a minimum Fixed Charge Coverage Ratio (FCCR) of 1.0x–1.2x and a minimum DSCR of 1.25x, with 2.0x or higher signaling a quality credit.
- Since 2000, four distinct periods of market dislocation have materially spiked default rates; managers with below-market default rates and superior recoveries across all four cycles have demonstrably outperformed on a risk-adjusted basis, per J.P. Morgan data cited by OHA.
- PGIM’s large-cap private credit analysis documents that larger-scale borrowers exhibit historically lower defaults and higher recovery rates, reinforcing the size-resilience relationship at the portfolio construction level.
Red Flags in Cash Flow Stress Tests
- DSCR below 1.25x in the base case. There is no stress buffer. Any revenue softness triggers a covenant breach or worse.
- CapEx classified as “growth” that is operationally required. Maintenance capex understatement inflates free cash flow and masks true debt capacity constraints. Capital-intensive businesses (heavy manufacturing, infrastructure) face particular scrutiny here.
- Customer concentration above 25%. A single-customer loss in the moderate stress scenario can be immediately impairment-level. Per LBO debt capacity frameworks, concentrated revenue streams reduce bankable cash flow significantly.
- Working capital swings not modeled. Seasonal businesses or high-growth borrowers that consume cash in receivables buildups can show EBITDA growth while generating negative FCFADS, a classic underwriting trap.
- Loose EBITDA add-backs. OHA’s 2026 analysis specifically flags vague EBITDA definitions as a structural documentation risk that borrowers exploit in LME negotiations.
Cash Flow Stress-Testing Underwriting Checklist
- Normalize three years of historical EBITDA. Remove non-recurring items, validate add-backs with supporting documentation, and reconcile to audited financial statements.
- Separate maintenance from growth capex. Request a multi-year capex schedule broken out by category. Confirm maintenance capex with engineering reports where available.
- Model working capital dynamics. Analyze DSO, DPO, and inventory turns across the last four quarters. Quantify seasonal peaks and the revolving credit facility capacity required to bridge them.
- Run three downside scenarios. Mild (−10% revenue), moderate (−20% revenue + customer loss), severe (−30%+ revenue + margin compression). Document the DSCR and FCCR output at each level.
- Identify the covenant breach point. Determine at what EBITDA level the maintenance covenant is triggered. Confirm there is adequate headroom, typically 20%–30%, between base-case projections and covenant thresholds.
- Stress-test the collateral. Apply forced liquidation haircuts to hard assets. Calculate LTV under the severe scenario. For cash-flow lenders, estimate enterprise value using a distressed EBITDA multiple.
- Assess management’s recession playbook. Ask specifically: What cost levers can be pulled in a 20% revenue decline? What is the timeline and magnitude of working capital release in a demand contraction?
- Document industry cyclicality benchmarks. Reference peak-to-trough EBITDA declines for the borrower’s sector in prior recessions. Compare the borrower’s stress performance against those benchmarks.
Key Takeaways
- Cash flow, not assets, drives debt capacity. The fundamental underwriting question is whether a borrower can service obligations across economic scenarios, not just at origination.
- DSCR below 1.25x in the base case leaves no stress buffer. Institutional lenders require this minimum; quality credits target 2.0x or higher to absorb moderate downside without covenant breach.
- Borrower size is a material credit variable. Data spanning 30 years shows that borrowers with EBITDA above $100M default at rates 32% lower than smaller peers, a factor that should inform portfolio construction and concentration limits.
- Recovery analysis is as important as default probability. Loss-adjusted spread, not nominal spread, is the true measure of risk-adjusted return; a higher-recovery portfolio can generate 44% more effective yield than a lower-recovery portfolio with identical gross spreads.
- Documentation discipline at origination is non-negotiable. Tight EBITDA definitions, explicit lender protections, and well-designed maintenance covenants are the primary defense against liability management exercises that can subordinate lender claims in out-of-court restructurings.


