
The Great Credit Bifurcation: Private Credit Reprices Risk as Public Markets Seize Up
April 18, 2026 | Bond Capital, Market & Sector Intelligence
Macro Headline: A K-Shaped Credit Market Takes Hold
The first quarter of 2026 has delivered the clearest signal yet that the post-pandemic credit supercycle is over. U.S. leveraged loan primary activity collapsed to approximately $241 billion: down 32–34% year-over-year: marking the weakest opening quarter since the 2020 pandemic shock, according to data cited by sikich.com and investor.wedbush.com. The proximate causes are well-documented: geopolitical instability, an oil price shock that pushed Brent crude above $120 per barrel in February, renewed inflationary pressure, and a Federal Reserve that has effectively paused its rate-cutting cycle after delivering only 50 basis points in cuts through end-2025.
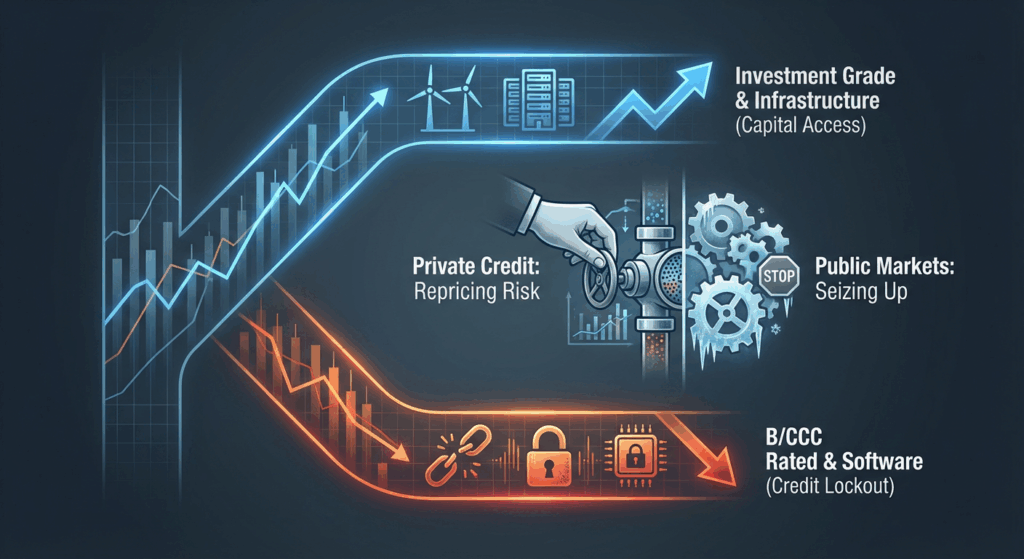
What has emerged is a structurally bifurcated, or “K-shaped,” credit market. On the upper arm, investment-grade and BB-rated borrowers with strong cash flows (Oracle, Electronic Arts, Hologic) continue to access capital, albeit at wider spreads. On the lower arm, a growing cohort of B- and CCC-rated issuers, particularly in software, media, and consumer-facing sectors, face a de facto credit lockout. This is not a cyclical dip. It is a structural repricing of risk that will define lending conditions through at least mid-2027.
Quantitative Market Snapshot
| Metric | Current (Q1 2026) | Prior Period | Source |
|---|---|---|---|
| U.S. Leveraged Loan Issuance (Q1 Total) | ~$241B | ~$355B (Q1 2025, -32–34% YoY) | sikich.com |
| Single-B Unitranche Spread (Private Credit) | SOFR + ~450–550 bps (widened) | SOFR + 450 bps (late Q4 2025, tightening) | mondaq.com |
| Single-B BSL Spread (Broadly Syndicated) | SOFR + ~419 bps (widened ~100 bps in Feb–Mar) | SOFR + 319 bps (Nov 2025 historic low) | mondaq.com / sikich.com |
| High-Yield Bond Spread (B-Rated Credits) | 3.17% (widened ~52 bps in Q1) | 2.65% (Q4 2025) | investor.wedbush.com |
| U.S. Private Credit Default Rate | 9.2% (record high, 2025 full year) | 8.1% (2024) | kslatv.marketminute.com |
| Loan Distress Ratio (Trading <80 cents) | 7.23% (March 2026) | Lowest in 3 years prior to Q1 2026 | investor.wedbush.com |
| Software Borrower Average Leverage | 7.4x EBITDA | 5.9x (broader loan pool average) | atlaspeakresearch.com |
| Public BDC Price-to-NAV | ~78 cents on the dollar (Mar 12) | ~85 cents (Jan 2026); ~par (early 2025) | atlaspeakresearch.com |
These metrics collectively confirm that underwriting standards have tightened sharply. Lenders are now demanding meaningfully higher spreads, stronger fixed charge coverage ratios, market participants indicate a minimum 1.20x–1.35x FCCR threshold is increasingly enforced, and total leverage multiples below 5.5x for new-money transactions in all but the most defensive sectors.
Sector Analysis: Where Lenders Are Leaning In, and Pulling Out
Software & SaaS, Under Maximum Pressure. The sector that defined private credit’s decade-long growth is now its most acute stress point. Software represents approximately 16% of the $1.5 trillion U.S. loan market: roughly $235 billion in outstanding exposure, with private credit carrying an estimated 20% software and services concentration, per BNP estimates cited by atlaspeakresearch.com. The risk profile is structurally challenged: approximately 50% of software loans are rated B- or lower, average leverage sits at 7.4x EBITDA versus 5.9x for the broader market, and equity values are down roughly 22% since January 2026, mechanically inflating loan-to-enterprise-value ratios on outstanding credits. The “SaaSPocalypse” narrative, driven by agentic AI disrupting traditional seat-based SaaS economics, has triggered a sector rotation out of software-heavy loan portfolios. New originations in software are facing meaningful covenant tightening and spread premiums of 75–125 bps above comparable non-tech credits.
Energy & Infrastructure, The New Safe Harbor. Capital is rotating decisively into hard-asset sectors. Infrastructure-related credit, power generation (particularly AI data center power infrastructure), and energy transition financing are attracting lender appetite that has retreated from tech. AI data center financing, exemplified by Oracle’s $38 billion debt package, is the marquee example of upper-arm credit viability, supported by long-term contracted revenue and tangible asset collateral. Lenders in these sectors are offering leverage up to 5.5x–6.0x with spreads in the SOFR + 300–375 bps range for investment-grade-adjacent credits.
Healthcare, Selectively Constructive. Healthcare and medical technology remain a relative bright spot, insulated by defensive revenue profiles and regulatory moats. However, tariff-driven uncertainty around pharmaceutical supply chains, including a 100% tariff on certain branded pharmaceuticals effective in 2025, has introduced meaningful underwriting complexity for companies with international procurement exposure, per investor.wedbush.com. Lenders are stress-testing supply chain assumptions more rigorously, and companies with domestic manufacturing or supply chain redundancy are commanding meaningfully better pricing.
Media & Retail, Lower Arm of the K. Cumulus Media’s second Chapter 11 filing in eight years, restructuring $592 million in debt in March 2026, crystallizes the existential pressure on legacy media credits. Traditional retail and consumer discretionary borrowers with floating-rate capital structures are similarly challenged as interest coverage ratios compress below 1.0x for weaker issuers.
Structural Shifts: The Retailization Risk and BDC Stress
Perhaps the most structurally significant development of Q1 2026 is the stress test now playing out across semi-liquid private credit vehicles sold through wealth channels. Blackstone’s BCRED received $3.7 billion in redemption requests: approximately 7.9% of NAV, requiring sponsor capital injection to honor. BlackRock’s HLEND saw $1.2 billion in withdrawal requests (9.3% of NAV). Cliffwater’s $33 billion Corporate Lending Fund faced ~14% redemption demand against a 7% repurchase cap. Blue Owl sold $1.4 billion in assets across three funds and removed the quarterly withdrawal option from a smaller vehicle, per atlaspeakresearch.com. These are not isolated events; they represent the first systemic stress test of the wealth-channel retailization model for private credit, and the liquidity mismatch is real.
Implications for Institutional Investors and Operators
For Borrowers: The “free money” era is over. Operators approaching refinancing windows in late 2026 or 2027 should begin lender dialogue immediately, particularly if they carry leverage above 5.5x EBITDA or operate in software, media, or consumer discretionary. The cost of rescue financing from private credit providers is now running at double-digit all-in yields for stressed credits. Asset sales to reduce leverage ahead of refinancing, rather than at the point of distress, will produce meaningfully better outcomes. Maintaining FCCR above 1.25x and demonstrating path-to-deleveraging are now minimum viable conditions for competitive pricing.
For Lenders and Investors: The performance gap between disciplined and undisciplined managers is widening rapidly. The “bad PIK” ratio reaching 6.4% of total private debt volume in Q1 2026, per KBRA and Fitch data cited by kslatv.marketminute.com, signals that deferred loss recognition is masking true credit quality deterioration in certain portfolios. Investors should scrutinize PIK income as a share of total BDC yield, non-accrual trends, and software sector concentration before allocating to any private credit vehicle. Closed-end fund structures remain structurally superior to semi-liquid vehicles in the current environment.
Forward-Looking View: What to Watch Through Q3 2026
Three variables will determine whether Q1 2026 marks the trough of this credit contraction or the beginning of a prolonged deleveraging cycle. First, the Federal Reserve’s rate path: any further inflation acceleration driven by energy prices or tariff pass-through will extend the “higher for longer” environment and accelerate defaults among floating-rate borrowers with thin coverage ratios. Second, software sector default velocity: the 46% of software loans maturing within four years, concentrated among B- and lower-rated issuers, represents a refinancing wall whose resolution will define the private credit cycle. Third, redemption pressure at semi-liquid vehicles: if outflows at major wealth-channel BDC platforms continue at Q1 pace, forced asset sales could trigger a secondary market dislocation that reprices the entire middle-market loan ecosystem. For now, the watchword is selectivity. Capital is available, but only for borrowers who can demonstrate resilient cash flow, defensible market position, and debt capacity comfortably within current underwriting guardrails.


