
The Underwriting Question Every Credit Committee Should Ask
Before a single dollar of capital is committed, a disciplined private lender must answer one foundational question: How much revenue can this borrower lose before it can no longer service its debt? This is not a rhetorical exercise. It is the quantitative heart of cash flow stress testing, the analytical process that separates rigorous underwriting from optimistic capital allocation.
In leveraged lending, where borrowers already carry elevated debt loads by definition, the margin for error is structurally thin. According to the Basel Committee on Banking Supervision’s updated Principles for the Management of Credit Risk (April 2025), sound credit-granting processes must explicitly evaluate a borrower’s debt service capacity across multiple forward-looking stress scenarios, not just base-case projections. For middle-market lenders and private credit managers, this mandate is not merely regulatory guidance. It is a survival discipline.
The Analytical Framework: Three-Scenario Stress Architecture
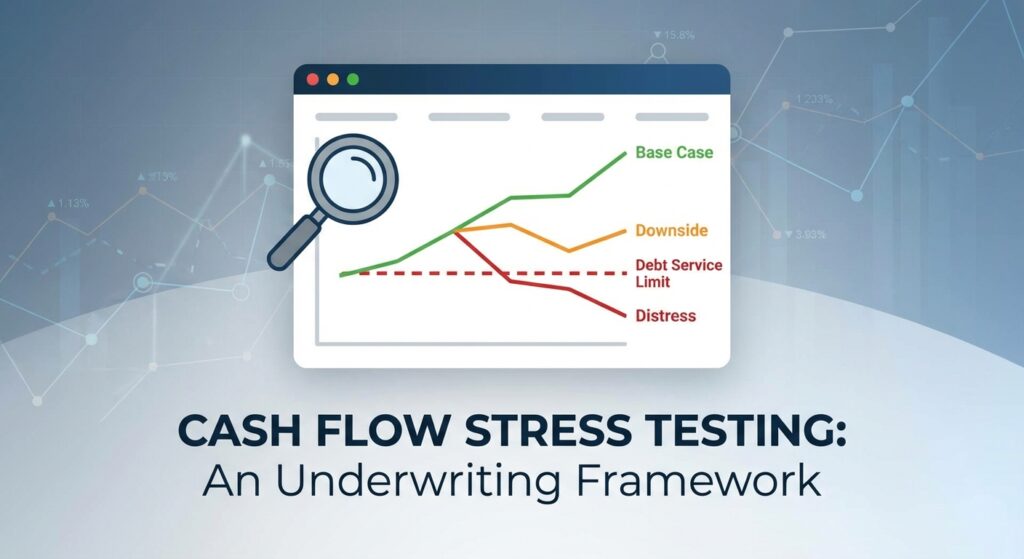
A credible cash flow stress test is built on three distinct scenarios applied to a normalized EBITDA base. Each scenario isolates a different source of credit risk and forces the analyst to evaluate covenant headroom, liquidity runway, and recovery positioning simultaneously.
- Base Case: Management-provided projections, adjusted for non-recurring items and revenue run-rate. This is the starting point, never the endpoint.
- Downside Case: A moderate contraction scenario, typically a 10–20% revenue decline, reflecting an industry correction, customer concentration loss, or margin compression from input cost inflation.
- Severe / Distress Case: A structural impairment scenario, 25–40% revenue decline, calibrated to the borrower’s specific sector. For cyclical industries such as manufacturing or distribution, this scenario should reflect actual recessionary trough performance from 2008–2009 or 2020.
Critically, each scenario must flow through a fully integrated three-statement model: income statement to EBITDA, EBITDA to free cash flow after capex and taxes, and free cash flow to debt service coverage. Surface-level EBITDA haircuts without working capital and capex adjustments produce dangerously misleading outputs.
Step-by-Step Walkthrough: A $10M EBITDA Manufacturing Company
Consider a hypothetical acquisition financing for a precision-parts manufacturer with $10M in trailing twelve-month (TTM) normalized EBITDA, $40M in senior secured debt (4.0x leverage), and a fixed interest rate of 8.5%, generating approximately $3.4M in annual interest expense. The first-lien term loan includes a maintenance covenant requiring Total Net Leverage to remain below 5.0x.
Step 1, Establish the Normalized Base: Begin by stripping all non-recurring adjustments from the Quality of Earnings report. Confirm that add-backs are supported by documentation and not structurally repeatable. Assume $10M normalized EBITDA is the ceiling, not the floor.
Step 2, Apply Downside Revenue Shock: A 15% revenue decline in this sector would reduce EBITDA by approximately 25–30% once operating leverage is applied (most manufacturers have 60–70% fixed cost structures). A 15% revenue cut produces roughly $7.0M–$7.5M in stressed EBITDA.
Step 3, Calculate Stressed Debt Service Coverage: At $7.0M stressed EBITDA, annual interest coverage falls to approximately 2.06x ($7.0M ÷ $3.4M). This remains serviceable but leaves limited runway for capex ($1.5M assumed) and cash taxes. Free cash flow after all obligations compresses to approximately $2.1M, a 57% reduction from base case.
Step 4, Measure Covenant Headroom: At stressed EBITDA of $7.0M, Total Net Leverage rises to approximately 5.7x ($40M ÷ $7.0M), breaching the 5.0x maintenance covenant. This is the inflection point that triggers lender remedies under the credit agreement, not default per se, but a critical monitoring threshold that must be built into ongoing portfolio surveillance.
Step 5, Apply the Distress Scenario: A 35% revenue decline, consistent with trough conditions in cyclical manufacturing, could compress EBITDA to $4.5M–$5.0M. At $4.5M, interest coverage falls to 1.32x, free cash flow is effectively zero, and leverage breaches 8.0x. Recovery analysis now dominates the credit picture.
What Institutional Lenders Require
Leading institutional credit managers, including large cap private credit platforms, consistently structure stress tests around sector-specific empirical data rather than uniform haircut assumptions. As PGIM’s Large Cap Private Credit research (January 2026) highlights, larger-scale borrowers with more resilient margins and experienced management teams have historically produced lower default rates and higher recovery rates, a direct product of stronger underlying cash flow durability under stress.
From a ratings methodology perspective, Fitch Ratings’ published criteria (2025) confirm that quantitative credit assessment centers on EBITDA-based leverage, interest coverage, and the sustainability of free cash flow generation, precisely the outputs that stress testing produces. Coverage ratios, leverage multiples, and liquidity buffers are the three metrics Fitch weights most heavily in corporate credit analysis.
Portfolio-level stress testing adds a second dimension. As Moody’s Analytics’ credit portfolio modeling framework demonstrates, concentration risk amplifies individual borrower stress: correlated industry exposures can transmit a single sector downturn across multiple portfolio positions simultaneously, compressing aggregate coverage ratios at exactly the moment liquidity is most constrained.
- Leveraged loan default rates in stress cycles have historically ranged from 8–12% annually at peak distress periods (2009, 2020), per Moody’s Analytics historical data.
- First-lien senior secured recovery rates on leveraged loans have averaged 60–70% in distressed resolutions, compared to 30–45% for subordinated debt, per S&P Global historical recovery studies.
- Maintenance covenant breaches have functioned as early warning triggers in the majority of restructurings, affirming that covenant headroom monitoring is a leading indicator of credit deterioration, not a lagging one.
Underwriting Checklist: Cash Flow Stress Testing
- Confirm normalized EBITDA base: Verify all add-backs against QoE report; reject unsupported or structurally non-recurring items.
- Map the fixed vs. variable cost structure: Determine operating leverage to translate revenue shocks into EBITDA impacts accurately.
- Build three integrated scenarios: Base, downside (10–20% revenue decline), and distress (25–40% decline); flow through full P&L and cash flow statement.
- Calculate interest coverage under each scenario: Flag any scenario producing coverage below 1.5x for immediate committee review.
- Measure covenant headroom at each stress level: Document the EBITDA floor at which the maintenance covenant is breached.
- Evaluate liquidity runway: Assess revolver availability, cash on hand, and minimum operating cash requirements under distress.
- Calibrate distress case to sector history: Use actual industry trough data, not uniform assumptions; manufacturing, retail, and healthcare carry materially different stress profiles.
- Document recovery positioning: In the distress case, confirm collateral coverage and lien seniority support an acceptable recovery outcome even if the credit deteriorates.
Key Takeaways
- ✦ Stress testing is not a sensitivity analysis: it is a structured simulation of sector-calibrated adversity applied to a fully integrated financial model, not a simple EBITDA haircut.
- ✦ Operating leverage is the multiplier: a 15% revenue decline in a fixed-cost-heavy business can produce a 25–30% EBITDA decline; failing to model this distinction is a systematic underwriting error.
- ✦ Covenant headroom is a leading indicator: maintenance covenant breaches historically precede formal defaults; monitoring headroom quarterly is the first line of portfolio defense.
- ✦ Free cash flow, not EBITDA, repays debt: interest coverage must be calculated after capex, taxes, and working capital investment, not at the gross EBITDA line.
- ✦ Portfolio correlation compounds individual stress: sector concentration in a credit portfolio means borrower-level stress events are rarely isolated; scenario analysis must account for contagion across positions.


