
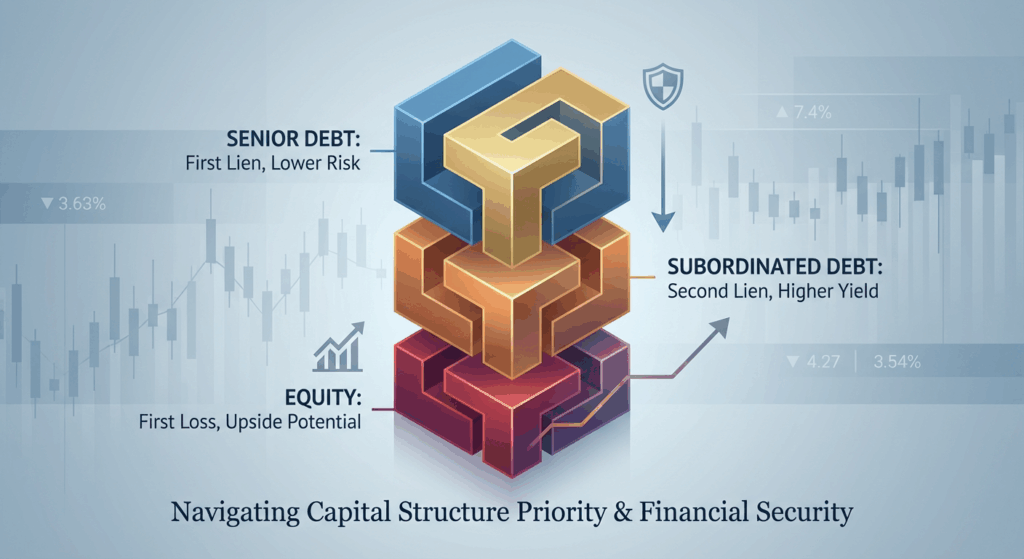
The DNA of Risk and Return
In the world of private credit, the “Capital Stack” is the single most important concept for understanding risk. Whether you are an investor seeking yield or a business owner raising capital, where a specific instrument sits in this hierarchy determines everything: the order of repayment, the level of protection, and the cost of capital.
At its core, the capital stack maps the priority of claims against a company’s assets and cash flow. It answers the fundamental question: “If things go wrong, who gets paid first?”
For decades, this structure was the domain of commercial banks and public bond markets. Today, as private credit expands into a multi-trillion-dollar asset class, understanding the nuances of seniority and subordination is essential for navigating the current financial landscape.
The Concept: Seniority vs. Subordination
The capital stack is organized by seniority. Instruments at the top have the first claim on assets (“First Lien”), while those at the bottom have the last claim (“Residual Claim”).
Risk increases as you move down the stack, and consequently, the expected return (or cost of capital) increases to compensate for that risk.
1. Senior Secured Debt
Sitting at the very top, Senior Secured Debt is the safest position. It is typically backed by specific collateral (assets, receivables, property). In a default scenario, these lenders are paid before anyone else. Because of this safety, senior debt carries the lowest interest rate in the stack.
2. Subordinated (Junior) Debt
Often referred to as “Mezzanine” or “Second Lien” debt, this layer sits below senior debt. If a company liquidates, subordinated lenders only get paid after the senior lenders have been made whole. to compensate for this increased risk of loss, these instruments offer higher yields.
3. Equity
At the bottom lies Equity (Common or Preferred). Equity holders enjoy the unlimited upside of the business’s growth but sit in the “first loss” position. If a company fails, equity is often wiped out completely before debt holders take a hit.
How It Works: A $100 Million Example
To see the capital stack in action, consider a hypothetical manufacturing business, “Alpha Corp,” with an Enterprise Value of $100 million.
The company finances its operations with the following structure:
- $50 Million in Senior Secured Debt (Cost: 8%)
- $20 Million in Subordinated Debt (Cost: 12%)
- $30 Million in Equity (Implied Cost: 25%+)
Scenario A: Success
The company is sold for $120 million.
1. Senior Lenders get their principal + interest.
2. Subordinated Lenders get their principal + interest.
3. Equity holders take the remaining $50 million (a significant gain on their $30m investment).
Scenario B: Distress
The company faces headwinds and is forced to liquidate assets for only $60 million.
1. Senior Lenders: They are owed $50m. They are paid $50 million in full (100% recovery).
2. Subordinated Lenders: They are owed $20m. There is only $10m remaining ($60m sale – $50m senior payout). They receive $10 million (50% loss).
3. Equity Holders: They receive $0 (100% loss).
This “waterfall” mechanism illustrates why senior credit is often viewed as a defensive asset class, while equity is an aggressive growth asset.
Current Market Relevance
The dynamics of the capital stack have shifted significantly in recent years. Following the regulatory tightening of Basel III, traditional banks retreated from portions of the lending market, creating a vacuum that private credit funds have filled.
According to recent industry analysis, this shift has reshaped the market structure:
- Market Scale: The private credit market has grown robustly, estimated between $1.3 trillion and $1.7 trillion, with direct lending accounting for approximately 40% of this aggregate (NAIC, 2024).
- Senior Focus: Despite the reputation of “alternative” lending being risky, a significant portion of capital raised has targeted senior debt strategies, often securing first-lien positions that were previously held by regional banks (Gridline, 2024).
- Yield Premium: Investors have turned to private credit because it offers a “complexity premium.” By accepting lower liquidity compared to public bonds, lenders can secure higher interaction protections and spreads (Lord Abbett, 2025).
Data Snapshot: The Private Credit Landscape
| Market Size Estimate | $1.7 Trillion | NAIC |
| Direct Lending Share | ~40% | NAIC |
| Primary Collateral | First Lien / Senior | Gridline |
Decision Framework
For Investors: Evaluating Risk
When reviewing a private credit opportunity, the first question should be: Where does this fund invest in the stack?
Protective Strategy: If capital preservation is the goal, focus on Senior Secured funds. The yield is lower, but the equity cushion (the value of the business above the loan amount) protects your principal.
Yield Strategy: If maximizing income is the goal, Subordinated or Mezzanine funds offer higher coupons, but they require a higher conviction in the borrower’s enterprise value stability.
For Operators: Optimizing Cost of Capital
Business owners must balance dilution against flexibility.
Use Senior Debt When: You have strong asset coverage and stable cash flows. It is the cheapest form of non-dilutive capital.
Use Subordinated Debt When: You need growth capital beyond what senior lenders will provide, but you do not want to sell more equity. It is more expensive than senior debt but cheaper than selling ownership stakes.
Key Takeaways
- Hierarchy is Absolute: In a default interactions, Senior Lenders are paid first; Equity holders are paid last.
- Equity Cushion Matters: The more equity (or junior debt) that sits below a loan, the safer the senior loan is.
- The Trade-off is Real: Moving down the stack increases yield but explicitly increases the risk of principal loss in liquidation.
- Market Shift: Private lenders have moved “up the stack,” increasingly replacing banks as primary senior secured lenders.
- Know Your Position: Whether investing or borrowing, your strategy must align with your position in the capital waterfall.


