
The Underwriting Question Every Private Credit Lender Must Answer
Here is the scenario: A sponsor presents a $10 million EBITDA manufacturing business seeking a $55 million senior secured term loan — implying a 5.5x leverage multiple. The five-year financial model shows steady 7–9% top-line growth, stable 28% EBITDA margins, and comfortable debt service coverage ratios (DSCR) of 1.6x throughout the hold period. On paper, it looks fundable.
But what happens when volumes drop 15%? What if rising input costs compress margins by 300 basis points? What if interest rates remain elevated for longer than the model assumes? These are not hypothetical disruptions — they are the ordinary stresses that middle market companies face across a typical five-year credit cycle.
In an environment where the share of so-called “bad PIKs” — retroactive payment-in-kind conversions that signal borrower liquidity strain — has surged from 36.7% in Q4 2021 to 57.2% in Q3 2025 according to reporting from ainvest.com, the stakes of weak cash flow underwriting have never been higher. The antidote is a structured, repeatable stress-testing methodology applied before a single dollar is committed.
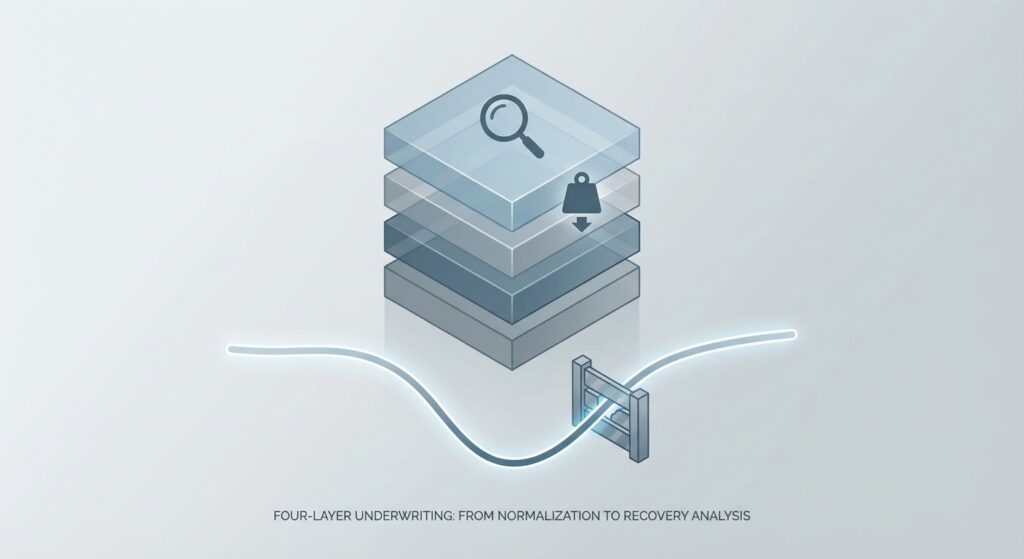
The Framework: Four-Layer Cash Flow Stress Testing
Experienced private credit lenders do not treat stress testing as a checkbox. They treat it as a parallel underwriting exercise run simultaneously with the base case model. The framework has four distinct layers:
- Base Case Validation — Verify the sponsor’s model against audited historicals and independently normalized EBITDA.
- Downside Case Construction — Apply sector-specific revenue haircuts, margin compression, and working capital deterioration.
- Liquidity Break Analysis — Identify the exact point at which free cash flow turns negative and covenant headroom is exhausted.
- Recovery Scenario Modeling — Estimate lender recovery under an enforcement scenario using collateral valuation and precedent transaction data.
Fitch Ratings’ published methodology reinforces this multi-dimensional approach. Their corporate credit framework measures “cash flow, earnings, leverage and coverage to assess credit risk” using EBITDA-based profitability, leverage, and coverage ratios — always focused on the ability to generate sustainable internal cash flows from operations, not a single-year snapshot. See Fitch Ratings’ Procedures and Methodologies (2025).
Walking Through the Calculations: The $10M EBITDA Manufacturing Example
Returning to our borrower. The underwriting team builds three scenarios alongside the sponsor’s base case:
Step 1 — Normalize EBITDA
Before any stress is applied, the team scrubs reported EBITDA. They remove $800K in one-time legal settlements, add back $350K in above-market owner compensation, and exclude $500K in non-recurring COVID-era government credits. Adjusted EBITDA lands at $8.95 million — not the $10 million headline figure. The leverage multiple immediately shifts from 5.5x to 6.1x on the same $55 million debt load. This single adjustment changes the credit committee conversation.
Step 2 — Define the Downside Case
Using a sector-specific revenue stress of minus 12% (consistent with the company’s own 2019–2020 performance during the prior manufacturing downturn) and margin compression of 250 basis points from input cost inflation, stressed EBITDA falls to approximately $7.1 million. At $55 million of debt, leverage rises to 7.7x — a level that would breach most institutional lenders’ maximum leverage covenants.
Step 3 — Model the DSCR Cascade
Assuming a 7.5% all-in interest rate and a 5% annual amortization schedule on the term loan, annual debt service is approximately $6.9 million. In the downside case, DSCR falls to approximately 1.03x — effectively at breakeven, with no cushion for unexpected capex, working capital swings, or litigation costs. A DSCR below 1.15x is widely treated as a covenant trip threshold by institutional direct lenders.
Step 4 — Liquidity Break Point
The team then models free cash flow after debt service under the downside scenario. After maintenance capex of $1.2 million annually, the company generates negative free cash flow of approximately $800K per year in a stress environment — meaning it draws on its revolving credit facility within 18 months and faces a liquidity crisis within 24 months absent sponsor support or asset monetization.
Moody’s Analytics’ portfolio modeling framework identifies exactly this dynamic: variation in credit quality “can increase quickly and in correlation with the macro-environment,” and even small miscalculations in risk and pricing can “undermine profitability” at the portfolio level. See moodys.com — An Overview of Modeling Credit Portfolios.
What Institutional Lenders Require — and Where Deals Break Down
Large-cap private credit platforms consistently demonstrate that scale and documentation discipline correlate with stronger credit outcomes. PGIM’s large-cap private credit strategy explicitly highlights that larger borrowers — with stronger revenue growth, more resilient margins, and experienced management teams — have historically produced lower default rates and higher recovery rates. See pgim.com — Underwriting Large Cap Private Credit.
The structural deterioration in middle market underwriting follows a recognizable pattern. Covenant-lite structures have reduced lender protections precisely when they are most needed. Opaque leverage levels and retroactive PIK conversions obscure true debt-service capacity. Lower middle market transactions often lack adequate financial cushions and governance frameworks to support lender oversight. These are not theoretical risks — they are the documented precursors to restructurings and impairments.
📊 Credit Risk Data Points to Know
- 57.2% of PIK conversions in Q3 2025 were retroactive “bad PIKs” — up from 36.7% in Q4 2021 — signaling systemic borrower liquidity strain in private credit (ainvest.com).
- Fitch’s leverage metric for non-bank financial institutions includes Debt/EBITDA and EBITDA/Interest Expense as core quantitative anchors for credit quality assessment (Fitch Ratings).
- Moody’s Analytics identifies loss given default (LGD), probability of default (PD), and correlation across industries and geographies as the three core inputs required for rigorous portfolio-level credit risk modeling (moodys.com).
- PGIM’s large-cap private credit research links borrower scale (>$75M EBITDA) to measurably lower default rates and higher post-default recoveries versus lower middle market peers (pgim.com).
The most common underwriting failure is not analytical — it is behavioral. Deal teams anchored to a sponsor relationship, a fee event, or a competitive loan process systematically underweight downside scenarios and overweight management projections. Rigorous stress testing must be institutionalized in the credit process, not left to individual underwriter judgment.
Cash Flow Stress Testing: The Underwriting Checklist
📋 Phase 1 — EBITDA Normalization
- ☑ Obtain three full years of audited financials plus trailing-twelve-month (TTM) management accounts
- ☑ Identify and challenge all add-backs exceeding 5% of reported EBITDA
- ☑ Verify revenue recognition policies — are large contracts recognized on delivery or percentage of completion?
- ☑ Assess owner compensation, related-party transactions, and non-recurring charges independently
📋 Phase 2 — Scenario Construction
- ☑ Build a base case anchored to three-year historical average performance, not management’s forward projections
- ☑ Apply a downside scenario using the company’s worst recent historical performance period as the revenue stress floor
- ☑ Model a margin compression scenario separately from revenue stress — input costs, labor, and freight can deteriorate independently of top-line
- ☑ Run a combined stress scenario (revenue down + margin compressed) and confirm DSCR remains above 1.10x
📋 Phase 3 — Covenant and Liquidity Calibration
- ☑ Set financial maintenance covenants with no more than 20–25% headroom to the downside case — not the base case
- ☑ Confirm revolver availability and any springing cash dominion triggers are properly structured
- ☑ Identify liquidity break point: the month in which stressed free cash flow plus revolver availability equals zero
- ☑ Document the early warning indicators — revenue miss, margin deterioration, or working capital deterioration thresholds — that trigger lender reporting or call rights
📋 Phase 4 — Recovery Analysis
- ☑ Identify and independently value all collateral: real estate, equipment, receivables, IP, and inventory
- ☑ Apply orderly liquidation value (OLV) haircuts to each collateral category
- ☑ Map recovery outcome against outstanding principal balance and any unpaid interest or fees
- ☑ Assess intercreditor dynamics if mezzanine or subordinated debt is present in the capital structure
Key Takeaways for Credit Underwriters
- EBITDA normalization is not optional. Headline sponsor EBITDA regularly overstates true cash generation by 10–20% in middle market transactions. Every add-back requires independent verification before it enters your leverage calculation.
- Stress test to the borrower’s own history, not to macro averages. Sector averages obscure company-specific volatility. The borrower’s worst historical performance period is your most honest downside input.
- Covenant headroom must be calibrated to the downside, not the base case. Covenants set with 30–35% headroom to base case projections provide no real protection when base case assumptions prove optimistic.
- Bad PIK proliferation is a portfolio-level warning signal. When retroactive PIK conversions are rising across a lender’s book, it indicates systematic underwriting pressure, not isolated borrower issues. Portfolio-wide stress reviews are warranted.
- Liquidity break analysis is the most underused tool in private credit underwriting. Identifying the precise month at which a stressed borrower exhausts its liquidity allows lenders to structure early intervention rights — converting a potential loss into a managed restructuring.


