
Bond Capital | Market & Sector Intelligence | September 7, 2026
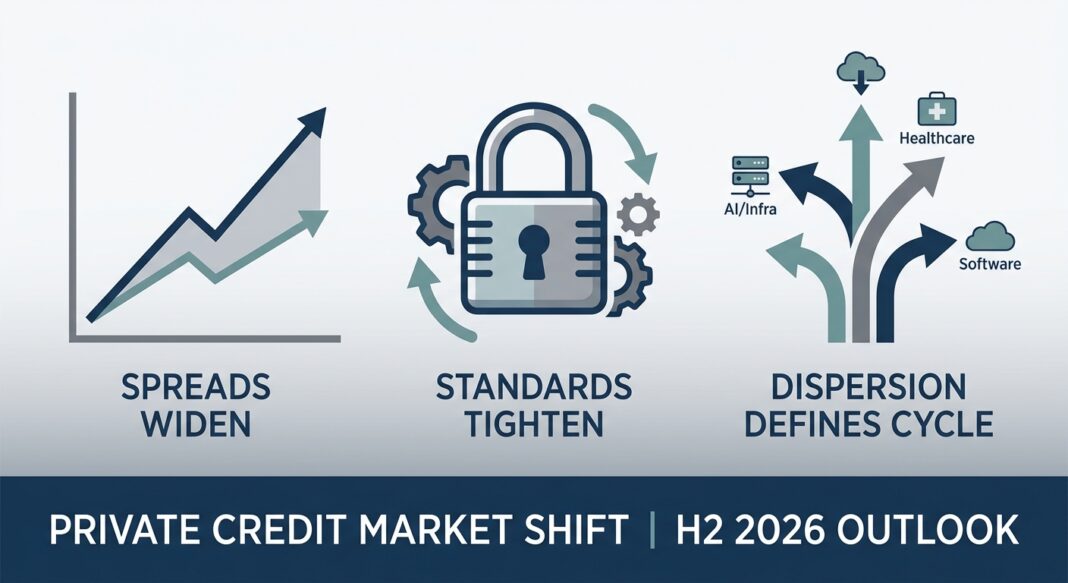
Private Credit’s Lender-Friendly Reset: Spreads Widen, Standards Tighten, and Dispersion Defines the H2 2026 Cycle
A macro-to-micro analysis of current rates, yield spreads, KPI thresholds, and lender appetite across public and private credit markets.
▲ Market Headline: The Cycle Has Turned — Lenders Are Back in the Driver’s Seat
The first half of 2026 marked a decisive inflection in the private credit cycle. After two years in which borrowers commanded tighter spreads, looser covenants, and elevated leverage, the market has rotated sharply in favor of lenders. Geopolitical shocks, AI-driven disruption to legacy software valuations, and a sustained higher-for-longer rate environment have collectively forced a repricing of risk that is now visible across every layer of the credit stack.
According to Lord Abbett citing PitchBook data, private credit spreads have widened by roughly 50 to 100 basis points since late 2025, while documentation terms have also improved meaningfully. The reversal reflects a convergence of forces: a spike in Fitch-measured default rates to 6.0% in April 2026, mounting FSB and SEC regulatory scrutiny, retail BDC redemption queues, and a sharp pullback in deal origination volumes — which dropped roughly 55% quarter-on-quarter to $33.6 billion in Q2 2026 from $74.7 billion in Q1 2026, per PitchBook/LCD data cited by Angel Investors Network.
At the same time, the macro rate backdrop remains unambiguously elevated. As of September 3, 2026, the 10-year U.S. Treasury yield stood at 4.79%, the 2-year at 4.39%, and the 30-year at 5.27%. The 3-month Term SOFR — the floating-rate benchmark underpinning the vast majority of private credit loans — sat at approximately 3.68% as of June 2026 per Valuation Research Corp., with SOFR at approximately 3.62% in April 2026. For borrowers, this means senior direct lending all-in coupons remain well into double-digit territory, materially compressing fixed charge coverage ratios across the portfolio company universe.
The second half of 2026 will be defined by dispersion: between sectors, between deal sizes, between lenders with dry powder and discipline, and between borrowers with genuine free cash flow and those masking distress through payment-in-kind arrangements.
■ Quantitative Market Snapshot
The table below synthesizes the most current publicly available credit market data as of Q2–Q3 2026. All figures are sourced directly from primary market publications and official data releases.
| Metric | Current Value (Q2–Q3 2026) | Prior Period | Source |
|---|---|---|---|
| Middle Market Private Credit Spreads (Upper MM) | S+500 bps (context) | S+mid-400s bps (late 2025) | Hamilton Lane, 2026 |
| Spread Change Since Late 2025 (PitchBook) | +50 to +100 bps wider | Compressed to multi-year lows | Lord Abbett / PitchBook, Jun 2026 |
| Software Sector Secondary Spreads (vs. B-rated loan index) | +229 bps above B-rated index; +245 bps vs. year-end | In line with broad market | PitchBook LCD via VRC, Jun 19, 2026 |
| Direct Lending Origination Volume (Q2 2026) | $33.6B (154 deals) | $74.7B (217 deals) in Q1 2026 | PitchBook/LCD via Angel Investors Network, Aug 2026 |
| Private Credit Default Rate (Fitch, April 2026) | 6.0% (record high) | 5.7% (Mar 2026); 5.8% (Apr 2025) | Fitch Ratings via Credit & Collection News, May 2026 |
| Proskauer Default Index (Q2 2026 — Senior Secured & Unitranche) | 2.51% (716 loans / $195.6B) | 3.0% for >$50M EBITDA in Q1 2026 | Proskauer Default Index via Investing.com, Aug 2026 |
| Private Credit vs. High Yield Spread Premium | ~150–200 bps over HY | ~350 bps over HY (2019) | Owners.pe, Apr 2026 |
| Middle Market Total Debt/EBITDA (Avg. Leverage Multiple) | ~5.5x (climbed from 4.5x in 2013) | ~4.5x (2013 post-GFC) | TCW, May 2026 |
| 3-Month Term SOFR | 3.68% (Jun 2026) | 3.67% (Mar 2026) | VRC, Jul 2026 |
| 5-Year U.S. Treasury Yield | 4.23% (Jun 2026) | 3.92% (Mar 2026) | VRC, Jul 2026 |
| Fed SLOOS: C&I Lending Standards (Q2 2026) | Basically unchanged; easier than historical midpoint | Tighter in Q1 2026 | Federal Reserve SLOOS, Jul 2026 |
KPI Thresholds: What Lenders Are Actually Requiring
With all-in debt costs elevated, fixed charge coverage ratios have come under significant structural pressure. For strong upper-middle-market credits, senior or unitranche loans are pricing at approximately SOFR + 425–475 bps, implying all-in rates of 9%–10% for top-tier borrowers, according to Private Capital Global citing Capstone Partners data. Core lower-middle-market loans carry spreads 50–100 bps higher, implying all-in rates of 10%–11% for smaller or marginally riskier credits.
At these coupon levels, a portfolio company carrying 5.5x total debt/EBITDA — the current market average per TCW’s May 2026 analysis — faces annual interest expense consuming roughly 55%–60% of EBITDA before amortization, capex, or taxes. Lenders are now requiring minimum FCCRs of 1.10x–1.25x at close, with covenant step-downs to 1.0x in stress scenarios. In the lower middle market (sub-$25M EBITDA), the FSB flagged that “true” leverage may be closer to 7x debt-to-EBITDA once EBITDA adjustments and add-backs are stripped out — a disclosure risk that is increasingly drawing regulatory attention. Separately, sponsor equity contributions have risen sharply: where PE firms contributed roughly 35% equity in 2019 buyouts, 50% equity checks have become commonplace in mid-market transactions today.
◆ Sector-by-Sector Lender Appetite & Structural Shifts
The defining structural feature of the current private credit cycle is bifurcation. Capital is not evenly distributed across sectors; it is concentrating in a narrow band of preferred credits while withdrawing from AI-exposed software, consumer products, and highly leveraged healthcare. The following sector-level breakdown synthesizes current lender behavior.
⛔ Enterprise Software & Legacy SaaS — TIGHTER
The most acute sector stress in the private credit market. Secondary spreads for software credits are approximately 245 bps wider than year-end levels and roughly 229 bps above the broader B-rated loan index, per PitchBook LCD data cited by VRC as of June 19, 2026. The acceleration of large language model (LLM) enterprise adoption has compressed the disruption timeline for traditional SaaS business models from multi-year horizons to merely quarters, per Capstone Partners’ Q1 2026 Leveraged Finance Update. Private credit’s software concentration — estimated to exceed 20% of many portfolios — has left the asset class acutely vulnerable, per Columbia Threadneedle. Many large enterprise software transactions financed between 2019 and 2022 under low-rate conditions lacked meaningful free cash flow generation, creating acute refinancing risk in the current cycle. Lenders are requiring substantial FCCR cushions and AI-disruption stress tests as part of underwriting for any software credit.
⚠ Healthcare — SELECTIVE (Structural Divergence)
Healthcare led all sectors in private credit volume in 2025, accounting for 19% of all direct lending deals per Octus Data. It was also the only major sector not to see significant year-over-year spread tightening in 2025, reflecting premium pricing for structural complexity. However, healthcare has simultaneously led all sectors in non-accrual rates among BDC portfolios, per Morgan Stanley Investment Management, which maintained a significant underweight to the sector. Demographic tailwinds and non-cyclical service models attract capital to select sub-sectors (physician practice management, specialty pharma services), but reimbursement risk and regulatory headline exposure are creating a bifurcated lender response.
✅ Infrastructure, AI Data Centers & Energy Transition — STRONG APPETITE
The most compelling capital formation story of the cycle. Morgan Stanley estimates, per Creative Planning, that private credit could supply more than half of the $1.5 trillion needed for global data center buildouts through 2028, while AI-related private credit loans nearly doubled in the 12 months through early 2025 per UBS. Chambers & Partners’ 2026 Private Credit guide notes that private credit has been “leading the development of financing structures for large-scale AI-related infrastructure.” Asset-backed and infrastructure debt strategies are now capturing a growing share of fundraising, with direct lending’s share of total private debt capital raised globally falling from 58.4% in 2024 to just 31% in Q1 2026 as allocators diversified into infrastructure debt, real estate credit, special situations, and asset-backed strategies per Wellington Management. Renewable energy and digital infrastructure projects benefit from long-term contracted cash flows that offer predictable FCCR coverage, making them especially attractive to lenders managing portfolio-level default exposure.
📈 Industrials & Non-Cyclical Services — IMPROVING
Middle market private equity activity has shown signs of improvement, with deal value increasing approximately 10.7% year-over-year and exit activity rising 14% over the same period per PitchBook data cited by VRC. In the lower middle market specifically, the spread premium over large-cap has actually widened to 232 basis points per Avante Capital Partners, reflecting the absence of institutional capital at that segment and creating a structurally favorable setup for disciplined lenders. Business services, specialty distribution, and government-contracted industrial services are seeing active pipeline development, supported by boomer-succession M&A dynamics.
Structural Shift: Banks Re-Enter, But Only at the Top
A critical dynamic reshaping competitive dynamics: VRC’s Q2 2026 Private Markets Report confirmed that banks have gradually returned to the upper middle market in Q2 2026, contributing to increased competition and alleviating some upward spread pressure at that tier. This is corroborated by the July 2026 Federal Reserve SLOOS, which found C&I lending standards basically unchanged in Q2 with current standards easier than the midpoint of historic ranges since 2005 — a meaningful softening from the tighter posture of Q1 2026. However, the bank re-entry is concentrated in large-firm demand: KPMG’s SLOOS analysis noted that approximately 16% of banks cited stronger demand for C&I loans from large businesses, versus just 4% for small firms. This structural gap continues to favor private credit lenders in the sub-$50M EBITDA segment.
Regulatory deregulation has also altered the competitive landscape. Chambers & Partners’ 2026 guide notes that in December 2025, the OCC and FDIC jointly rescinded the March 2013 Interagency Guidance on Leveraged Lending, giving institutions greater flexibility to define leveraged loans on institution-specific terms — potentially allowing certain bank-affiliated private credit platforms to compete at deeper leverage levels than previously permitted.
⚠ Regulatory & Macro Overlay: The FSB Puts the Market on Notice
The regulatory environment surrounding private credit has escalated materially in 2026. On May 6, 2026, the Financial Stability Board warned that private credit vulnerabilities pose increasing systemic risk, citing three specific concerns: (1) procyclical redemption pressures forcing asset sales, (2) hidden leverage through side letters and subscription credit lines, and (3) interconnection with banks through lending facilities exceeding $1.9 trillion. Forbes analysis of the FSB’s May 2026 report identified four vulnerability clusters: bank interconnections, borrower credit quality and valuation opacity, concentration and liquidity mismatches, and data gaps. The SEC has also opened inquiries into large private credit managers, per Capstone Partners’ Q1 2026 Leveraged Finance Update.
The PIK (payment-in-kind) distortion problem is particularly acute. Forbes’ analysis noted that 40% of private credit borrowers carry negative free cash flow and that official 1%–2% default rates may understate true credit deterioration, with PIK arrangements allowing distress to compound invisibly. Fitch’s data revealed payment-in-kind interest reaching 6.4% of all private loans by end of Q4 2025, per Credit & Collection News — a leading indicator of the April 2026 default spike. Insurance sector exposure is also drawing regulatory heat: Barclays analysis cited by Forbes found that private credit assets held by U.S. life insurers grew more than 20% in 2025, reaching approximately 10% of total assets, with the Treasury Department assembling a dedicated team to assess insurer exposure.
▶ Implications for Operators & Institutional Investors
For Borrowers & Operators
- All-in floating-rate coupon costs of 9%–11% will continue to pressure FCCR below the 1.25x threshold for companies carrying more than 5x leverage — refinancing windows must be planned 12–18 months ahead.
- Equity sponsors must anticipate 50%+ equity contributions at deal close in competitive M&A processes; bridge financing assumptions from 2021–2022 are no longer executable.
- Software and AI-exposed businesses face materially wider spreads and heightened lender due diligence; companies must present credible AI disruption mitigation plans and defensible recurring revenue metrics.
- Asset-backed collateral significantly improves access to capital; ABF Journal (May 2026) notes the center of gravity in middle market finance is shifting toward asset-based and non-bank structures as commercial banks pull back from cash-flow lending.
- Hybrid capital instruments (preferred equity, convertible notes) are gaining traction as sponsors navigate compressed FCCR coverage and structurally elevated debt costs.
For Institutional Investors & Lenders
- Widening spreads create genuine yield re-entry opportunities for disciplined managers: S+500 bps on senior secured paper, combined with improving documentation and covenant terms, represents the most lender-favorable environment since 2020.
- The 150–200 bps premium over public high yield remains positive but is significantly compressed from the 350 bps of 2019 — investors must demand structural protections (covenants, PIK limitations, equity cure rights) to justify illiquidity cost.
- The lower middle market ($5M–$25M EBITDA segment) offers a 232 bps spread premium over large-cap private credit — the structural alpha opportunity the institutional capital wave has yet to reach, per Avante Capital Partners.
- Non-accrual dispersion is widening: Wellington Management found BDC median non-accruals rose from 0% in 2022 to 0.33% in Q1 2026 while the 75th percentile climbed to 1.37% — manager selection risk is as important as asset class allocation.
- Infrastructure debt, real estate credit, and asset-backed finance strategies are capturing increasing allocator flows; direct lending’s share of total private debt fundraising fell from 58.4% to 31% in just five quarters.
🔭 Forward-Looking View: Liquidity & Lending Dynamics, H2 2026 – Q2 2027
VRC’s Q2 2026 report confirmed that market expectations continue to reflect a higher-for-longer rate environment, with the forward curve broadly flat as of June 2026. The 5-year Treasury yield increased to approximately 4.23% in June, up from 3.92% in March. With 3-month Term SOFR anchored near 3.68%, the floating-rate mechanics of direct lending will continue to compress FCCR headroom for portfolio companies — and default rates are forecast to rise further, with DLD projecting approximately 2.5% for full-year 2026 (by volume) and Fitch having already recorded 6.0% by its broader definition.
The dry-powder deployment gap is the single most important structural tension heading into Q4 2026. PitchBook/LCD data shows Q2 2026 origination at only 154 completed transactions — the weakest quarter since Q2 2023 — while fundraising remained robust. GPs that begin to feel LP pressure on deployment may accept looser terms or stretch on credit quality, repeating the late-cycle dynamics of 2023–2024. The healthy read of current data, however, is that the majority of direct lenders have maintained standards and allowed volume to fall rather than credit quality.
The massive refinancing wave represents the clearest near-term catalyst for deal flow. ABF Journal notes that trillions of dollars of corporate debt issued in the low-rate era are set to mature between 2026 and 2028, and collateral-backed structures are well positioned to capture middle market borrowers that no longer fit a cash-flow lending box. Meanwhile, Lord Abbett’s midyear outlook notes that M&A activity is creating more lending opportunities and that managers with dry powder and the discipline to remain selective are structurally advantaged heading into H2 2026.
✎ Bond Capital: Five Key Market Insights
- Spreads Have Structurally Reset. Private credit spreads in the S+500 bps context represent the highest lender compensation since 2020, and improving covenant documentation signals that this is a structurally driven repricing, not a temporary dislocation. Lenders entering or expanding commitments now are doing so at the most favorable structural entry point in five years.
- Default Rates Are the Cycle’s Key Variable. The wide gap between Fitch’s 6.0% rate and Proskauer’s 2.51% reflects definitional differences, not an absence of stress. PIK accumulation (6.4% of all loans), negative borrower free cash flow (40% of borrowers), and EBITDA adjustment opacity mean true portfolio quality may be materially worse than headline non-accrual rates suggest. Underwriting discipline around FCCR and free cash flow conversion is non-negotiable.
- The Lower Middle Market Is the Structural Alpha Opportunity. With a 232 bps spread premium over large-cap private credit, near-zero institutional capital penetration, genuine covenants, and a growing succession-driven deal supply, the sub-$25M EBITDA segment remains the most compelling risk-adjusted opportunity for operators and specialized lenders.
- Infrastructure & Asset-Backed Finance Have Permanently Expanded the Private Credit Universe. Direct lending’s share of private debt fundraising has fallen from 58.4% to 31% in five quarters. AI data center finance, infrastructure debt, and ABL structures are now institutional asset class priorities in their own right and will account for an increasing share of both origination and portfolio construction through 2027.
- Regulatory Exposure Is a Board-Level Credit Risk. FSB, SEC, Treasury, and Federal Reserve scrutiny is intensifying simultaneously across NAV facilities, PIK structures, insurer exposure, and bank interconnections. Managers and operators who proactively enhance transparency, tighten disclosure practices, and stress-test for correlated liquidity scenarios will be significantly better positioned to navigate the next phase of regulatory standardization.


