
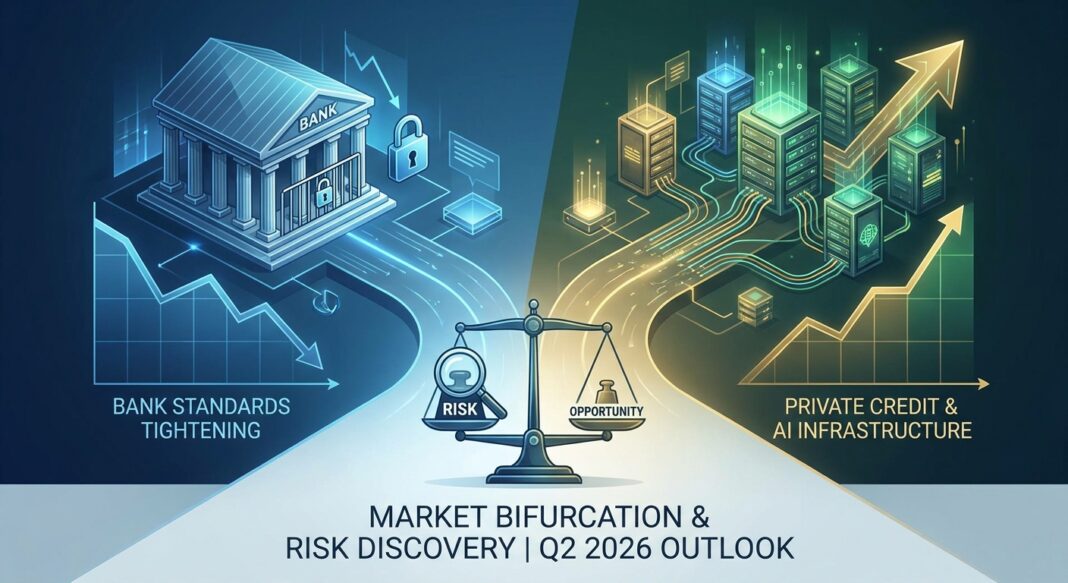
Bond Capital — Market & Sector Intelligence
Published: 21 May 2026 | Issue: Q2 2026 Credit Markets Edition
Price Discovery Resumes: Private Credit Reprices Risk as Bank Standards Tighten and Sector Bifurcation Deepens
A quantitative and structural analysis of public and private lending markets, spread dynamics, KPI thresholds, and lender appetite — Q2 2026
I. Market Headline: The Repricing Has Begun
After an extended period of historically tight spreads and intensifying lender competition, Q1 2026 marked a credible inflection point across U.S. credit markets. The convergence of three independent shocks — a sharp AI-driven selloff in technology and software equities, renewed geopolitical risk in the Middle East, and a persistent “higher-for-longer” rate posture from the Federal Reserve — pushed credit markets decisively back into price discovery mode.
The signal from private credit was unambiguous. Valuation Research Corporation (VRC) increased credit spread ranges across all private credit instrument classes by 25 basis points in its March 2026 pricing matrix, the first broad-based spread widening since the rate-hiking cycle peak. Secondary markets moved faster: average B-rated loan spreads in the secondary market ended Q1 approximately 67 basis points wider than year-end 2025 levels. Primary market activity did not escape: by March 2026, deal volumes were 42.4% below January levels.
Simultaneously, the banking channel tightened further. The April 2026 Fed Senior Loan Officer Opinion Survey (SLOOS) confirmed that, on balance, banks tightened C&I lending standards for firms of all sizes across Q1, while reporting basically unchanged demand — a configuration historically consistent with late-cycle credit tightening rather than cyclical normalization. For operators and institutional investors, the operative reality is this: the free-money era of near-historic-low spreads and covenant-lite structures is giving way to a more discriminating, bifurcated lending environment where sector, quality tier, and AI-exposure profile are becoming primary pricing variables.
II. Quantitative Market Snapshot
The table below consolidates the most critical market metrics as of late Q1/early Q2 2026. Each metric is sourced from institutional data providers and reflects the most current available figures at the time of publication.
| Metric | Current Value (Q1/Q2 2026) | Prior Period | Change / Signal | Source |
|---|---|---|---|---|
| Private Credit Spreads (All Instruments) | +25 bps vs. Q4 2025 pricing matrix | Unchanged Q3–Q4 2025 | ⇧ Widening | VRC Q1 2026 |
| Secondary B-Rated Loan Spreads | ~+67 bps vs. YE 2025 | Near cycle tights, YE 2025 | ⇧ Significant widening | VRC Q1 2026 |
| Private Credit Spreads (Senior Direct Lending) | S+500 context (up from mid-400s bps) | Mid-400 bps over SOFR, late 2025 | ⇧ ~50–60 bps wider | Hamilton Lane, Feb 2026 |
| First-Lien Direct Lending All-In Yield (Projected Trough) | 8.0%–8.5% (2026 trough estimate) | ~9%+ in 2024–early 2025 | → Compressing, still elevated | Morgan Stanley IM |
| U.S. High-Yield Bond Spreads (OAS) | ~325 bps over Treasuries (near 20-yr tights) | ~304–305 bps (YE 2025) | ⇧ Slight widening; still tight | Morningstar, May 2026; Man Group |
| Fed Funds Target Rate (SOFR Base) | 3.50%–3.75% (held steady, Q1 2026) | 3.50%–3.75% (Q4 2025) | → Unchanged; hawkish tilt | Northleaf Q1 2026 |
| Bank C&I Tightening Standards (Large/Mid-Market Firms) | Net +5.3% tightening (Q1 2026, SLOOS) | Net tightening Q4 2025 (Jan SLOOS) | ⇧ Continued tightening | Fed FRED / SLOOS |
| Bank C&I Tightening Standards (Small Firms) | Net +8.9% tightening (Q1 2026, SLOOS) | Net tightening Q4 2025 | ⇧ Accelerating for small firms | Fed FRED / SLOOS |
| LTM Leveraged Loan Default Rate (by Issuer Count) | 1.36% (Feb 2026); 3.54% incl. distressed exchanges | 4.24% avg (2025, incl. distressed) | ⇩ Improving headline; distressed ratio rising | Hamilton Lane (Feb 2026) |
| Distressed Loan Ratio | 8.89% (Feb 2026) | 4%–5% range for most of 2025 | ⇧ Sharp deterioration; forward default risk indicator | Hamilton Lane (Feb 2026) |
| U.S. Direct Lending Volume (Full-Year 2025) | $247 billion (842 transactions) | $277B+ in 2024 (record year) | ⇩ –11% YoY; 2nd busiest on record | DLA Piper / PitchBook LCD |
| Middle Market Spread Premium vs. Large Corporate Loans | ~+110 bps (avg since 2008) | Historically stable structural premium | → Persists; risk-reward improving | Bernstein, Feb 2026 |
Note: All-in yields reflect floating-rate SOFR-based structures. Spread comparisons use OAS or spread-to-maturity depending on instrument. Sources cited above; data as of latest available at publication date.
Key KPI Thresholds: What Lenders Are Underwriting To
On the credit quality and structuring front, two KPIs are front and centre for underwriting committees in Q2 2026. First, interest coverage ratios (a close proxy for Fixed Charge Coverage Ratios, FCCR) are under measurable pressure: as of March 31, 2026, approximately 7% of BCRED’s private debt portfolio companies carried interest coverage ratios below 1.0x, a threshold that signals acute debt service vulnerability. While Goldman Sachs Private Credit Corp reported portfolio company EBITDA growth and improving interest coverage ratios at year-end 2025, and maintained a weighted average loan-to-value of 42.1% with 97.8% first-lien positioning, the aggregate picture is one of meaningful dispersion — a bifurcated cohort where strong sponsors retain favourable terms while weaker credits face increasingly strict covenant packages and higher pricing.
III. Sector Analysis: Lender Appetite & Structural Shifts
● Technology & AI Infrastructure — Bifurcated: AI Infrastructure Hot; Software/SaaS Cold
The technology sector in 2026 is emphatically not monolithic. Technology and software services loans are pricing at wider-than-average premiums driven by risk-off conditions, lower implied enterprise values, and higher loan-to-value ratios quarter-over-quarter; lenders are now evaluating AI-impacted borrowers on a strictly case-by-case basis. The Bloomberg U.S. Leveraged Loan Index posted materially negative returns in early 2026, driven primarily by widening spreads linked to revaluation of AI-related technology credits, creating a 1.83% performance gap versus the high-yield bond index through early March. The January 2026 SLOOS confirmed that a major net share of banks reported being less likely to approve C&I loans to firms adversely affected by AI — a structural shift that is funnelling adversely exposed borrowers toward the private market at a price premium.
Conversely, AI infrastructure is commanding extraordinary capital. Morgan Stanley estimates private credit could supply more than half of the $1.5 trillion needed for global data center buildouts through 2028, while UBS reports that AI-related private credit loans nearly doubled in the twelve months through early 2025. “Private credit can meaningfully complement banks and can support non-hyperscale contracted offtakes,” according to Marsh Risk’s Alex Wolfson, as data center financing becomes a weekly institutional conversation in 2026.
● Healthcare — Selectively Active; Non-Accrual Watch Required
Demographic shifts and non-cyclical service models continue to attract private credit lenders seeking stable cash flows in healthcare. However, Morgan Stanley IM maintains a significant underweight to the sector, noting that healthcare has led all sectors in loans placed on non-accrual status over the last year. Lender appetite remains concentrated in non-cyclical sub-segments (CROs, CDMOs, revenue cycle management) with demonstrable AI-enabled efficiency gains, while physician practice management and MedTech face ongoing valuation mismatches.
● Infrastructure & Asset-Based Finance — Fastest-Growing Category
Asset-based finance is now larger than all other private credit markets combined, with structural tailwinds from bank retrenchment, insurance demand for rated assets, and AI/data center financing needs. In infrastructure, private credit is being used to fund large-scale projects such as renewable energy developments that require significant capital investment. Regulatory relief has amplified the opportunity: in December 2025, the OCC and FDIC rescinded the 2013 Interagency Guidance on Leveraged Lending, allowing lenders to make their own determinations of risk appetite and giving private credit managers greater flexibility to underwrite a broader range of loans.
● M&A / LBO Market — Volume Up, Count Down; Larger Deals Dominating
U.S. M&A/LBO deal volumes in Q1 2026 increased by more than 30% relative to Q1 2025, though transaction count declined over the same period, reflecting fewer but larger transactions. Periods of market volatility typically see banks and liquid credit markets retrench, with private equity sponsors turning to private credit for greater execution certainty — a pattern playing out in real time. However, elevated redemptions in retail-oriented vehicles have led some large private credit lenders to moderate investment activity, contributing to more attractive supply and demand dynamics for well-capitalised lenders backed by institutional capital.
● Bank-Private Credit Structural Shift — Deepening Co-Existence
Banks are increasingly partnering with private credit managers rather than holding risk directly on their balance sheets, a transformation accelerating as Basel IV implementation deepens in Europe and U.S. banks use forward flow agreements with private debt firms to offload ABF assets. The April 2026 SLOOS captured a notable new dimension: banks reported tighter standards on all categories of NDFI loans over the past year, with the most widely reported changes including higher premiums on riskier loans, stricter loan covenants, shorter maturities, and tighter collateralization requirements — directly impacting private credit funds that rely on bank-provided subscription and NAV facilities.
IV. Implications for Borrowers, Operators & Institutional Investors
For Borrowers & Operators
- FCCR discipline is non-negotiable. With B-rated secondary spreads 67 bps wider and primary markets re-pricing, operators must demonstrate sustainable FCCR above 1.25x to access capital at competitive rates. Borrowers below 1.0x ICR face acute refinancing risk.
- Sector identity matters. Lenders are bifurcating underwriting by AI exposure profile. Borrowers in software or consumer sectors face wider spreads and higher covenant scrutiny; AI infrastructure and asset-heavy businesses with contracted offtakes command premium access.
- Timing and relationship premiums have widened. With primary deal volumes down 42% from January peaks, sponsors with existing lender relationships retain meaningful execution advantages. New-to-market borrowers should expect tighter documentation and more detailed information requests.
- Bank alternatives remain valid but costlier. Bank C&I tightening — net +5.3% for large/mid firms and net +8.9% for small firms — means private credit pricing, while wider than late-2025 levels, is often the fastest route to capital for middle-market operators.
For Institutional Investors & Lenders
- The illiquidity premium is rebuilding. Private credit has historically delivered 200–400 bps of excess return over liquid credit markets; with spreads repricing to S+500 context on senior direct lending, this premium is re-establishing after compression in 2024–2025.
- Manager selection is the primary alpha source. The distressed ratio at 8.89% and the rising non-accrual concentration in healthcare and certain software verticals signal meaningful performance dispersion ahead. Headline default issues have been company-specific, not systemic — but distinguishing idiosyncratic from structural risk requires deep underwriting.
- Scale and institutional capital are structural advantages. Retail fund redemption pressures are moderating deployment for some large managers, creating supply/demand dynamics that favour well-capitalised institutional lenders who can provide execution certainty.
- Covenant quality is diverging rapidly. Through Q3 2025, nearly half of middle market deals had two or more covenants compared to only 10% for larger transactions — a structural protection premium that warrants active allocation toward the lower and core middle market.
V. Forward-Looking View: Liquidity & Lending Dynamics, Next 3–6 Months
The forward rate curve, as of April 1, 2026, implies an average base rate of approximately 3.5% over the remainder of 2026 through 2028 — approximately 20 basis points higher than expectations last quarter. This repricing of the forward curve, combined with geopolitical uncertainty and the AI disruption overhang, sustains a structurally higher cost of capital environment even as nominal policy rates remain static. Market participants now project interest rates will remain higher for a longer period than previously expected, with limited easing priced into 2026.
On the supply side of capital, the secular case for private credit remains intact. Nearly one-third of U.S. insurer assets — almost $2 trillion of the $6 trillion in invested assets — are now allocated to private credit sub-asset classes, providing a structural demand floor. However, total private credit capital raised in Q1 2026 fell to $32.3 billion, roughly half of Q1 2025’s $64.3 billion, driven by fundraising concentration among top-tier managers and a challenging environment for mid-sized GPs.
The most consequential forward dynamic is a structural supply/demand rebalancing. New deal demand combined with a large refinancing wave is expected to gradually overtake private credit supply, allowing lenders to preserve discipline, strengthen terms, and capture the illiquidity premium to public markets. Substantial dry powder remains available, and a stabilisation in AI-related concerns or geopolitical tensions could allow markets to reopen quickly — suggesting the current re-pricing is calibrated rather than a sustained dislocation. For institutional participants, the 3–6 month window presents an opportunity to commit capital at spreads that are structurally wider than the 2024–2025 compression cycle, provided underwriting discipline is maintained and sector positioning avoids AI-disrupted software and consumer cohorts facing covenant pressure.
◆ Five Key Market Insights — Bond Capital Intelligence Desk
- Spreads are repricing, not collapsing: The Q1 2026 +25 bps private credit matrix widening and +67 bps secondary B-rated spread move represent a credible risk premium rebuild — not a credit crisis. Headline defaults remain below 10-, 20-, and 25-year averages. The distressed ratio at 8.89% is the key forward indicator to monitor.
- AI is the new sector dividing line: Banks are more likely to approve loans to AI-beneficiaries and explicitly less likely to approve to AI-threatened businesses (Jan 2026 SLOOS). Private credit lenders are mirroring this posture with case-by-case underwriting. Sector identification now precedes leverage and coverage analysis in many credit committees.
- The lower middle market offers the best structural risk-reward: With nearly half of middle market deals carrying two or more covenants vs. 10% for large corporates, and a stable 110 bps spread premium, disciplined lower-middle-market direct lenders retain superior downside protection at currently elevated all-in yields of 8.0%–8.5%.
- Asset-based finance has surpassed direct lending in scale: ABF is now the largest private credit sub-category, driven by bank retrenchment, insurance demand for rated assets, and AI infrastructure buildout. Operators and institutional investors in energy, real estate, and digital infrastructure should evaluate ABF structures as a primary financing tool.
- Fundraising concentration is accelerating manager selection risk: Q1 2026 private credit fundraising halved year-on-year outside the top-tier manager cohort. For institutional LPs, due diligence on manager liquidity terms, valuation discipline, and portfolio AI-exposure concentration is now a first-order underwriting priority, not a secondary consideration.


