
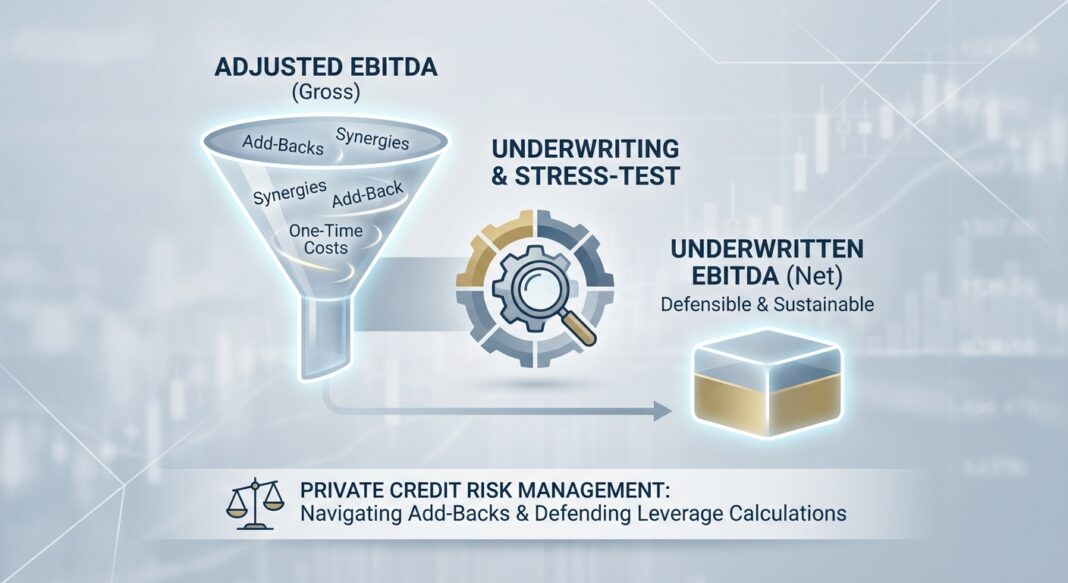
The Underwriting Problem: When Adjusted EBITDA Becomes a Fiction
Every credit underwriter has seen the deal memo that arrives with a borrower presenting $12M in “Adjusted EBITDA” — only for the QoE team to uncover that $4.2M of that figure rests on contested add-backs: a one-time legal settlement labeled “non-recurring,” aggressive synergy assumptions from a recent bolt-on, and owner compensation normalized to a below-market rate. Strip those out, and the lending multiple collapses, the coverage ratio fails, and the deal no longer underwrites at the proposed structure.
This is not an edge case. In today’s private credit market, EBITDA normalization is the single most consequential — and most contested — step in the credit underwriting process. As lenders tighten standards and institutional LPs demand greater transparency, the bridge from reported GAAP earnings to the EBITDA number a lender will actually underwrite has become a critical battleground in every middle-market transaction.
The stakes are measurable. According to Fitch Ratings, the U.S. private credit default rate hit a record 9.2% in 2025, following a prior record of 8.1% in 2024 — with smaller issuers carrying $25M or less in EBITDA comprising the majority of those defaults. Mispriced earnings at origination is among the root causes. Getting EBITDA right at the underwriting stage is not an accounting exercise; it is a loss-prevention discipline.
The Analytical Framework: Four-Stage EBITDA Bridge
Disciplined lenders build a structured EBITDA bridge that moves in four stages: Reported → Adjusted → Normalized → Lender-Underwritten. Each step requires its own evidence standard and stress-testing logic.
Stage 1: Reported EBITDA (GAAP Baseline)
Start with net income and add back interest, taxes, depreciation, and amortization as reported in audited financials. This is the only number with external verification. Every subsequent adjustment requires documentation and lender sign-off.
Stage 2: Adjusted EBITDA (Sponsor or Borrower Presentation)
The borrower or sponsor presents their view of “true earnings” by removing items they characterize as non-recurring, non-operating, or owner-specific. Common add-backs at this stage include restructuring charges, transaction fees, above-market owner compensation, non-cash stock-based compensation, and one-time legal costs. In private credit agreements, common add-backs also extend to run-rate adjustments, pro forma synergies, and company-specific operational items.
The problem: adjusted EBITDA is a seller-oriented number. It maximizes the earnings base to support a higher valuation and a larger loan. Lenders must independently challenge every line item.
Stage 3: Normalized EBITDA (QoE-Verified)
Normalized EBITDA is the defensible, sustainable subset of adjusted EBITDA — the figure that reflects how the business actually performs under a market-rate operator in a representative period. A Quality of Earnings (QoE) analysis is the primary tool for testing adjustments and reconciling the EBITDA bridge to the general ledger and actual cash flows.
The QoE validates revenue quality (recurring vs. project-based), reserve policies, working capital trends, and the cash conversion cycle. Critically, it stress-tests whether claimed cost savings have been executed or are merely projected, and whether so-called one-time items are truly non-recurring or are appearing in multiple periods.
Stage 4: Lender-Underwritten EBITDA
The lender applies its own credit overlay to the QoE-verified number. This includes applying add-back caps required by institutional policy, haircuts to synergy assumptions, and LTM (last twelve months) vs. NTM (next twelve months) weighting. This is the EBITDA used to set leverage ratios, size the loan, and set covenant thresholds. This number is almost always lower than the borrower’s adjusted EBITDA — and the gap between the two is a measure of underwriting discipline.
Example: $10M EBITDA Manufacturing Company
| EBITDA Bridge Item | Borrower ($000) | Lender Haircut ($000) | Lender View ($000) |
|---|---|---|---|
| Reported GAAP EBITDA | $7,200 | — | $7,200 |
| + Owner comp normalization (above-market) | +$900 | -$150 | +$750 |
| + One-time legal settlement | +$600 | -$600 | $0 (recurring pattern) |
| + Acquisition synergies (unexecuted) | +$1,100 | -$770 | +$330 (30% credit) |
| + Non-cash stock compensation | +$200 | $0 | +$200 |
| Underwritten EBITDA | $10,000 | -$1,520 | $8,480 |
At 5.0x leverage, borrower’s EBITDA supports a $50M loan. Lender-underwritten EBITDA supports only $42.4M — a $7.6M difference in lending capacity and a meaningfully different leverage ratio at closing.
The Analysis: Identifying Problematic Add-Backs and Running Stress Cases
The Three-Category Test for Every Add-Back
Experienced credit professionals apply a simple three-tier classification to every proposed add-back:
- Green Light: Non-market owner compensation, personal expenses, one-time legal settlements with no pattern of recurrence, duplicate costs from completed integrations, and discontinued SKUs. These are objectively removable and documented.
- Yellow Light: “Temporary” cost reductions without signed vendor contracts, growth investments treated as add-backs rather than pro forma drivers, and below-market affiliate transactions. These require evidence and a cap.
- Red Light: Evergreen consulting fees that reappear annually, structural overhead that will return post-close, recurring revenue shortfalls labeled as “non-recurring,” and revenue enhancements with no supporting contracts. These are rejected.
Add-Back Caps: The Institutional Standard
Recognizing that expansive add-backs can materially distort leverage calculations, institutional lenders routinely impose caps on projection-based and non-recurring adjustments. In practice, these caps are often expressed as a percentage of EBITDA — commonly in the 15%–25% range — applied to the aggregate of more speculative add-backs such as run-rate cost savings and pro forma synergies. Time-based restrictions (e.g., 18-month realization windows for synergies) are also standard in well-structured credit agreements.
For cost savings and synergies specifically, lenders in the middle market continue to negotiate caps that limit the add-back to consummated transactions, resisting the broader inclusion of “revenue enhancements” without binding contract support.
Cash Flow Reconciliation: The EBITDA-to-Cash Conversion Test
A critical cross-check often neglected in early-stage underwriting is the reconciliation between normalized EBITDA and actual operating cash flow. If a borrower’s EBITDA has grown but cash from operations has stagnated or declined, this is a structural warning signal. Causes include deteriorating working capital (lengthening DSOs, shrinking payables), aggressive revenue recognition, or capitalization of costs that should be expensed. All three inflate EBITDA without generating cash available for debt service.
The fixed charge coverage ratio (FCCR) — which measures cash flow available for debt service against total debt service obligations (interest + scheduled principal) — is the more conservative metric precisely because it integrates capital expenditure and working capital movements that EBITDA ignores. A well-underwritten deal targets FCCR of 1.20x or higher under the base case, with documented stress cases showing the path at 1.0x or better under a downside scenario.
Stress Testing Framework
Institutional underwriters run at least three scenarios: (1) Base Case using lender-underwritten EBITDA with normalized capex; (2) Downside Case reflecting a 15%–20% revenue contraction and margin compression of 200–300 bps; and (3) Severe Downside modeling a recessionary shock. Coverage ratios, liquidity runway, and covenant headroom are mapped across all three. If the severe downside case results in a covenant breach within 12 months, the structure requires redesign — either through a smaller loan, tighter equity cushion, or enhanced covenant protections.
Industry Standards: What the Credit Data Tells Experienced Lenders
The current credit cycle provides sobering evidence for why EBITDA discipline matters. Consider the following data points:
📊 Credit Performance Data Box
- 9.2% — Fitch Ratings’ U.S. private credit default rate in 2025 (record high), up from 8.1% in 2024. Smaller issuers with $25M or less in EBITDA represented the majority of defaults. (Source: Fitch Ratings, March 2026)
- 39% — Par-weighted average first-lien recovery rate for broadly syndicated loans in 2024, down sharply from 51% in 2023 and 76% in 2022, driven by liability management exercises (LMEs), sector composition, and capital structure complexity. (Source: Fitch Ratings via Alternative Credit Investor, April 2025)
- ~70% — Historical long-term ultimate recovery rate on first-lien term loans per Moody’s data, versus 47% for senior unsecured bonds. (Source: Cambridge Associates, citing Moody’s)
- 64% — Share of all default events in H1 2025 attributable to distressed exchanges, matching the record annual share set in 2024. Loan-only capital structures backed by private equity sponsors exhibited the most distress. (Source: Moody’s Ratings, July 2025)
- ~1.47% — Estimated annualized credit loss for the broader Cliffwater Direct Lending Index (CDLI) across senior and non-senior middle market loans, 2017–2025. (Source: Cliffwater / Morgan Stanley Investment Management, 2025)
The divergence between historically strong senior secured recovery rates (~65%–75% long-term) and the 39% recovery observed in 2024 BSL defaults illustrates a structural deterioration driven by aggressive liability management, weakened covenant packages, and capital structures built on over-stated EBITDA at origination. Middle market lenders with full maintenance covenants, tighter add-back definitions, and conservative underwritten EBITDA are better positioned to intervene early and limit losses.
Common Red Flags That Experienced Lenders Watch For
- EBITDA add-back stack exceeds 20% of reported earnings: When adjustments collectively represent more than one-fifth of base EBITDA, the entire earnings narrative deserves heightened skepticism. The borrower’s normalized number is increasingly a model output rather than a business reality.
- Recurring “one-time” items: If restructuring charges, legal settlements, or integration costs appear in three or more consecutive periods, they are a recurring cost of doing business and should not be added back.
- Revenue-based synergy add-backs: Lenders in the middle market continue to resist revenue enhancement add-backs without binding contract support. Cost savings are defensible only when tied to executed initiatives with documented evidence.
- High leverage + floating rate + minimal hedging: Fitch identified predominantly floating-rate capital structures with minimal interest rate hedges as a primary driver of 2025 defaults. At elevated SOFR levels, interest coverage ratios compress rapidly for borrowers already stretched at origination.
- Cov-lite structures masking underlying stress: Per LSEG Yield Book data, cov-lite loans tend to produce lower recovery rates when defaults occur, because lenders lack the early-warning mechanism that maintenance covenants provide. Private credit lenders maintaining full financial maintenance covenants retain critical intervention rights.
Underwriting Checklist: EBITDA Normalization Diligence
The following checklist reflects institutional best practices for evaluating normalized EBITDA in a private credit underwriting process:
Documentation Requirements
- ☑ Three years of audited or reviewed financial statements (five years preferred for cyclical sectors)
- ☑ Independent Quality of Earnings (QoE) report from a nationally recognized accounting firm
- ☑ Detailed EBITDA bridge from GAAP net income to adjusted/normalized EBITDA, tied to the general ledger
- ☑ Support documentation for every add-back exceeding $100K: invoices, settlement agreements, employment contracts, vendor termination notices
- ☑ Working capital analysis covering DSO, DPO, DIO trends over the last 12–24 months
- ☑ Capex schedule distinguishing maintenance capex from growth capex
Questions to Ask the Borrower or Sponsor
- ☑ Has this add-back item appeared in any prior period? Produce the last five years of P&L and explain each occurrence.
- ☑ For synergy add-backs: what has been executed vs. what is planned? Provide signed contracts or board-approved implementation plans.
- ☑ What is the normalized capex requirement to sustain current EBITDA margins? Is maintenance capex being under-invested?
- ☑ How does EBITDA reconcile to cash from operations in the most recent 12-month period? Explain any divergence exceeding 10%.
- ☑ What is the owner/operator’s replacement cost? Obtain market comparables from an independent third party.
- ☑ Are any related-party transactions (rent, management fees, intercompany loans) priced at market rates? Provide independent benchmarks.
Lender Stress-Test Requirements
- ☑ Model FCCR under base, downside (−15% revenue), and severe downside (−25% revenue) scenarios
- ☑ Calculate leverage and coverage at lender-underwritten EBITDA (not borrower-adjusted EBITDA)
- ☑ Set financial maintenance covenants with 20%–30% headroom to underwritten EBITDA in base case
- ☑ Confirm add-back caps are defined in the credit agreement as a percentage of EBITDA, with time-based sunsets for synergy assumptions
Key Takeaways
- 🔹 Normalized EBITDA is not adjusted EBITDA. The borrower’s adjusted number is a starting point, not a finish line. Lenders must independently verify every add-back against source documentation, and apply haircuts to speculative items like unexecuted synergies and projected cost savings.
- 🔹 The EBITDA-to-cash-flow reconciliation is non-negotiable. Divergence between EBITDA growth and operating cash flow is the clearest early indicator of earnings quality problems — including working capital deterioration, aggressive revenue recognition, or understated capex requirements.
- 🔹 Add-back caps protect leverage calculations. Institutional lenders impose percentage-of-EBITDA caps on speculative adjustments. These caps prevent aggressive stacking of marginal add-backs that cumulatively distort the leverage ratio used for loan sizing and covenant setting.
- 🔹 Recovery rates are not guaranteed — and are deteriorating. First-lien recovery fell to 39% for BSL defaults in 2024, well below the 65%–75% long-term historical average. Covenant-light structures, LME activity, and overleveraged capital structures are structural drivers. Private credit lenders with full maintenance covenants and conservatively underwritten EBITDA retain superior intervention rights and recovery prospects.
- 🔹 Default rates in 2025 were driven by small borrowers with floating-rate debt and weak cash flow. Fitch’s record 9.2% private credit default rate was concentrated in companies with under $25M in EBITDA carrying predominantly floating-rate debt with minimal hedges — exactly the profile created by over-stated EBITDA, under-sized equity cushions, and inadequate stress testing at origination.


