
The Underwriting Problem: Which EBITDA Are You Actually Lending Against?
Every leveraged credit transaction begins with a deceptively simple question: how much does this business earn? The answer, in practice, is never singular. A borrower’s Confidential Information Memorandum (CIM) may present an adjusted EBITDA figure that is 30% to 50% higher than reported net income — and that delta is where credit risk is either uncovered or concealed.
Normalized EBITDA is a buyer-underwritable estimate of sustainable, recurring operating earnings. It starts with reported EBITDA, removes non-recurring, non-operating, and owner-specific items, and then adjusts for supportable run-rate effects that a lender can reasonably rely on. The operative word is supportable. In today’s environment, macro-economic uncertainty, elevated interest rates, and selective credit have triggered a shift toward more disciplined investor behaviors. Limited partners and institutional credit committees are no longer extending benefit of the doubt to management add-backs: they are demanding a documented earnings bridge that survives independent scrutiny.
For credit underwriters at direct lending desks and private credit funds, the discipline of EBITDA normalization is not a financial modeling exercise — it is the first and most consequential line of defense against mispriced risk.
The Analytical Framework: Building a Defensible Earnings Bridge
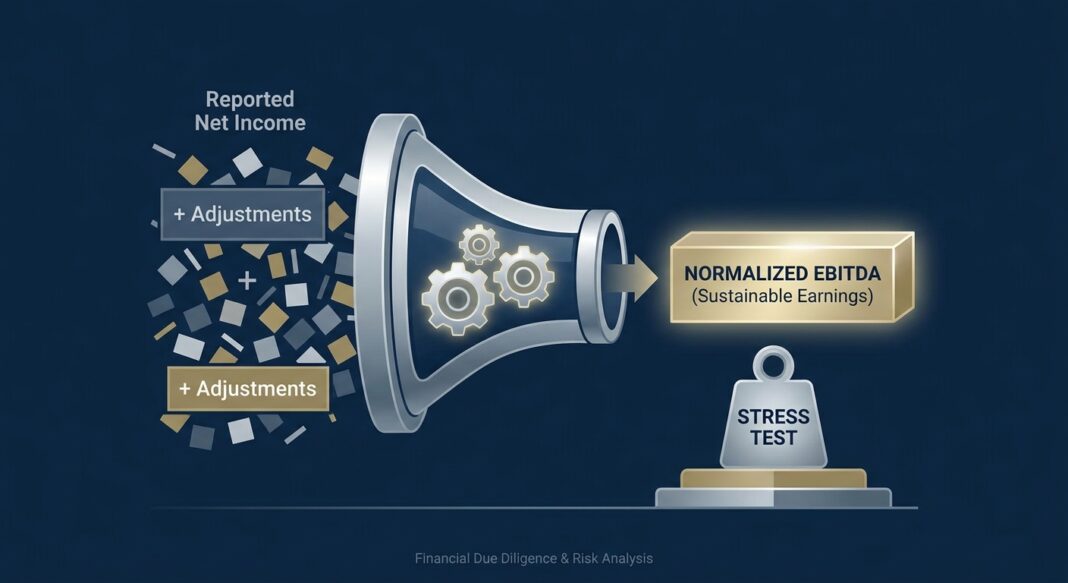
The normalization framework flows in a structured sequence. Normalized EBITDA is calculated by starting with reported net income, adding back interest, taxes, depreciation, and amortization to reach EBITDA, then applying owner-specific and non-recurring adjustments line by line. Each line requires documentation. Appraisers document every line with supporting data because buyers and their advisors scrutinize each adjustment during quality-of-earnings diligence.
The standard formula is: Normalized EBITDA = Reported EBITDA ± Owner Compensation Adjustment ± Personal Expense Add-backs ± One-Time Cost Add-backs ∓ One-Time Revenue Items ± Rent Normalization.
Critically, buyers often think of adjusted EBITDA as the bridge from reported financials to a cleaned-up earnings number, and normalized EBITDA as the earnings a buyer can sustainably underwrite after considering steady-state staffing, market compensation, and necessary reinvestment. The practical takeaway is that adjusted EBITDA can be higher than reported EBITDA, but it can also be lower. If the business benefits from under-market rent paid to a related party, or if owner labor is underpaid relative to a market replacement, a buyer may normalize costs upward, which reduces EBITDA.
Example: Analyzing a $10M EBITDA Manufacturing Company
Consider a founder-led manufacturer presenting $10.4M in adjusted EBITDA. The earnings bridge includes: (1) $1.2M in owner salary above a $350K market replacement; (2) $400K in legal settlement labeled non-recurring; (3) $250K in personal vehicle and travel expenses; (4) $600K in one-time facility relocation costs. The gross adjusted figure looks compelling — but under-market rent from a related party ($180K below market), unfunded pension obligations ($300K), and deferred maintenance capex ($500K) require downward normalization. The defensible run-rate EBITDA is closer to $9.2M — a $1.2M difference that at a 5.5x leverage multiple translates to $6.6M in incremental debt capacity that was never real.
A single rejected $100K add-back at a 6x multiple costs $600K in enterprise value. For lenders, the same arithmetic determines whether leverage is accurately sized or dangerously understated.
The Analysis: Calculations, Stress Tests, and Issue Identification
Once a normalized EBITDA figure is established, the underwriter’s next task is to translate it into credit metrics and stress test those metrics against downside scenarios.
Core Credit Metrics Derived from Normalized EBITDA:
- Total Leverage Ratio: Total Debt ÷ Normalized EBITDA. Most institutional direct lenders underwrite senior leverage at 4.0x–5.5x for middle-market credits.
- Interest Coverage Ratio (FCCR): (Normalized EBITDA − Capex − Cash Taxes) ÷ Cash Interest. A minimum of 1.20x is typical; breach triggers covenant review.
- EBITDA-to-Cash Conversion: Measures whether EBITDA translates into actual free cash flow. EBITDA-to-cash conversion below 70% over a 3-year average is a recognized red flag in financial due diligence.
Stress Test Scenario (Using the $9.2M EBITDA Example):
Assume $40M total debt at 5.0% all-in cost, generating $2.0M annual interest expense. At normalized EBITDA of $9.2M, leverage is 4.3x and FCCR is approximately 2.8x — healthy. Now apply a 20% revenue decline (consistent with a moderate recession scenario for a cyclical manufacturer). EBITDA contracts to approximately $6.4M assuming 50% fixed cost structure. Leverage rises to 6.25x and FCCR falls to 1.7x — still above default thresholds but within covenant-watch territory. A 30% revenue shock brings EBITDA to approximately $5.0M, leverage to 8.0x, and FCCR to 1.1x — a covenant breach scenario requiring active portfolio management.
If EBITDA normalization is overly aggressive, DSCR may appear acceptable on paper but fail during underwriting. This is one of the most common reasons deals stall or collapse.
Industry Standards: What Institutional Lenders Require
Institutional credit committees have sharpened their scrutiny of EBITDA adjustments in the current cycle. Limited partners at PE funds demand further transparency and lenders are tightening underwriting standards. The QoE review — once optional in competitive processes — is now standard practice. Over 70% of M&A transactions now require formal financial due diligence QoE.
A lender-grade QoE review evaluates seven core areas: revenue recognition, customer concentration, revenue quality, gross margin trends, add-back support, reserves, accounting cutoffs, working-capital behavior, cash conversion, and the relationship between EBITDA and cash flow.
Common Red Flags in Borrower EBITDA Presentations:
- Revenue pulled forward: A strong quarter driven by timing — the business invoiced early, recognized revenue aggressively, or pushed deals to close before period-end. It can be GAAP-compliant and still be a warning sign for repeatability.
- Artificial margin expansion: Margins spike because the company paused hiring, cut marketing, delayed maintenance, or underinvested in support. EBITDA looks great, but the business cannot keep operating that way without paying the bill later.
- Structural add-back issues: Non-recurring expenses that appear recurring, related-party transactions, owner compensation adjustments, customer concentration, margin volatility, stale receivables, inventory reserve issues, and aggressive capitalization policies.
- Hidden cost normalization gaps: The business might be paying less than market rate rent to a related party, not carrying enough insurance, or putting off necessary upgrades and maintenance. There could also be unfunded pension or benefit obligations.
📊 Credit Performance Data Box
- Leveraged Loan Default Rate (Late 2024): By late 2024, the U.S. leveraged loan default rate climbed to a decade-high of 5.6%, driven largely by distressed exchanges. — FTI Consulting, 2025 Leveraged Loan Market Survey
- Projected High-Yield Default Rate (2025): High-yield bond issuers are projected to see a realized default rate of 3.2% for calendar year 2025, rising to above 4% by Q1 2026. — Moody’s U.S. Credit Review & Outlook, July 2025
- Leveraged Loan Default Rate (Forecast): For leveraged loan issuers, default rates are already nearly double the 3.4% historical average. The leveraged loan default rate is projected to end the year at 7.5%, rise to 7.9% in Q1 2026, and touch 7.3% in Q2 2026. — Moody’s, July 2025
- First-Lien Recovery Rates (Current): Moody’s has estimated expected ultimate recoveries on U.S. first-lien loans at roughly 68%, versus long-run historical experience in the high 70s. — Collateralized Loan Obligations Data, 2026
- Distressed Exchanges Share: The number of global corporate defaults ticked lower in 2024, to 145 from 153 in 2023. Nearly 60% of the defaults in 2024 were distressed exchanges. — S&P Global Ratings / Maalot, 2024 Annual Global Corporate Default Study
- Private Credit Loss Rates: Credit losses for senior direct lending are based on annualized data between 2017 and 2025 from the Cliffwater Direct Lending Index – Senior (CDLI-S). The broader Cliffwater Direct Lending Index (CDLI), representative of both senior and non-senior loans for middle market borrowers, would produce an estimated annualized loss of 1.47%. — Morgan Stanley Investment Management / Cliffwater, 2025
The recovery rate data underscores the structural importance of accurate EBITDA normalization. Aggressive out-of-court restructurings — drop-down financings, uptiering exchanges — can strip collateral or subordinate existing lenders, producing recoveries well below traditional bankruptcy outcomes for non-participating lenders. When lenders over-rely on an inflated EBITDA, they extend excess leverage that compresses the equity cushion — the very buffer protecting first-lien recovery in distress.
Additionally, maintaining robust underwriting standards, such as ensuring the company is not excessively leveraged and has sufficient equity buffer, is crucial for capital recovery. Financial maintenance covenants may also increase recovery rates as they provide lenders the opportunity to react early to a borrower facing financial stress.
The Underwriting Checklist: EBITDA Normalization Due Diligence
The following step-by-step framework reflects institutional underwriting practice for evaluating EBITDA adjustments on a new credit opportunity:
- Request Three Years of Audited Financials + TTM Management Accounts. Never begin normalization from a CIM alone. Tie every reported period back to audited or reviewed statements.
- Build a Line-by-Line EBITDA Bridge. Start from net income. Add back interest, taxes, D&A. Document each add-back with a source reference (invoice, contract, payroll record). Verify each item against actual GL entries.
- Test Owner Compensation Against Market. An owner paying themselves $800,000 in a market where a replacement manager costs $250,000 is suppressing reported EBITDA by $550,000. A buyer at 5x EBITDA loses $2,750,000 in value if that adjustment is missed. Use compensation benchmark data to size the adjustment.
- Identify and Verify All “Non-Recurring” Items. Can the adjustment be traced to records? Is the rationale clear? Would the cost truly disappear or change under new ownership? Is the adjustment consistent with how the business will operate after closing? If these questions cannot be answered affirmatively, haircut or reject the add-back.
- Apply Downward Normalizations (Add-downs). Sellers add back expenses to increase EBITDA; buyers sometimes make downward adjustments to remove one-time revenue or non-recurring income that inflated the seller’s trailing results, reducing adjusted EBITDA below the reported figure. Check for related-party rent below market, deferred capex, understaffing, or underinsurance.
- Reconcile EBITDA to Cash Flow. It is essential to compare EBITDA to actual cash flow. If the numbers do not match up, that is a sign that something might be off. If EBITDA goes up but the company is not bringing in more cash from its regular operations, that could mean the improved earnings are just on paper.
- Assess Customer Concentration Risk. Flag any scenario where a single customer accounts for more than 20-25% of revenue without long-term contractual protection. Stress test the EBITDA bridge for the loss of the top one or two customers.
- Run Scenario Analysis on Normalized EBITDA. Model base, downside (−20% revenue), and severe downside (−30% revenue) cases. Calculate leverage and FCCR under each scenario. Define the covenant threshold that triggers lender action.
- Document the Final Underwritten EBITDA. The credit committee submission should distinguish between Management EBITDA, Adjusted EBITDA, and Lender-Underwritten EBITDA — with a reconciliation table showing each adjustment, its documentation, and the underwriter’s acceptance or rejection rationale.
Key Documentation Requirements: Three years audited financials; TTM management accounts; payroll records for owner/family compensation; lease agreements and market rent comps; customer contracts and revenue recognition policies; capex history vs. stated maintenance capex; tax returns (to cross-check reported income).
Key Takeaways
- The earnings bridge is a credit risk document, not a marketing document. Every dollar of unsubstantiated EBITDA, multiplied by a leverage multiple, becomes a dollar of real capital at risk. Lenders must own the normalization process independently of management’s presentation.
- Adjusted EBITDA and normalized EBITDA are not the same thing. Management’s adjusted EBITDA is a starting point; lender-underwritten normalized EBITDA is the number that survives independent diligence, includes downward normalizations, and reflects steady-state operating reality under arm’s-length ownership.
- Default and recovery data demand conservative EBITDA underwriting. With U.S. leveraged loan default rates projected at 7.5% and first-lien recovery rates declining toward 68%, the margin for EBITDA misjudgment is structurally thinner than it was in prior cycles.
- EBITDA-to-cash-flow reconciliation is non-negotiable. An earnings figure that does not convert to free cash flow cannot support debt service. Cash conversion below 70% over a multi-year average is a structural red flag that warrants either covenant tightening or a reduced advance rate.
- Covenant design must reference the underwritten EBITDA, not management’s adjusted figure. Financial maintenance covenants calibrated to an inflated EBITDA provide false security. Lenders should set leverage and coverage triggers against the conservatively normalized run-rate — preserving their right to act early if performance deteriorates.


