
The Underwriting Problem Hidden Inside Every EBITDA Bridge
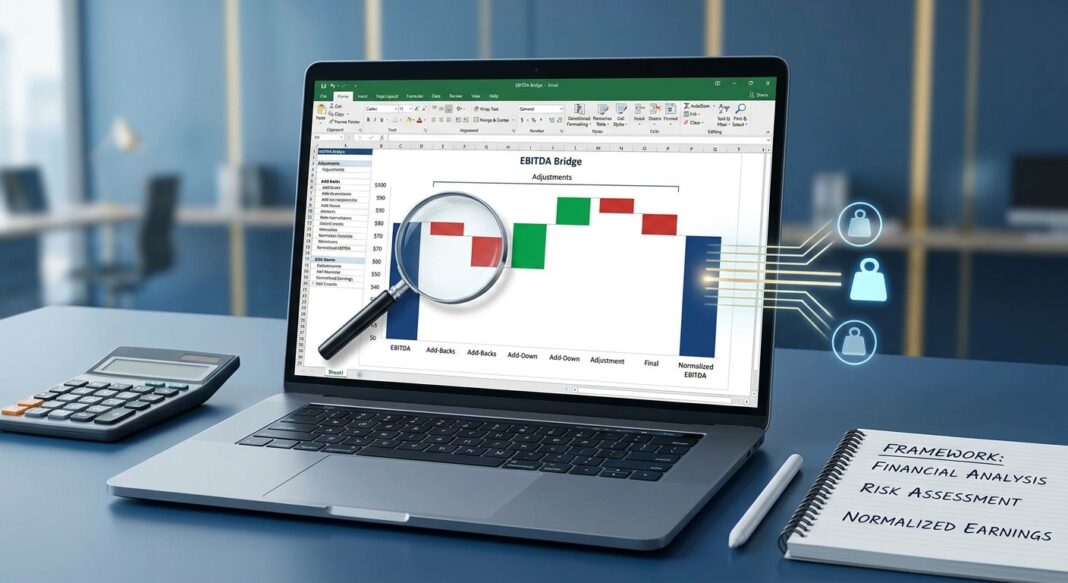
A manufacturing borrower presents a $10M EBITDA business and requests a $55M senior secured term loan—a 5.5x leverage multiple that, on its face, sits inside most institutional lenders’ guidelines. But look closer at the EBITDA bridge. There is $2.1M in add-backs: $700K in “one-time” legal costs, $500K in owner compensation excess, $400K in COVID-related disruption, $300K in a consultant project, and $200K in “non-recurring” restructuring. Strip away those adjustments and the true run-rate EBITDA is closer to $7.9M—implying real leverage of 6.97x, a materially different credit picture.
This scenario repeats itself across every deal cycle. Reported EBITDA is a starting point; normalized EBITDA is what gets underwritten. And the gap between the two is where credit losses are born. As one practitioner standard puts it, adjusted EBITDA is not a marketing exercise—it is an underwriting discipline, and the lender who treats it otherwise absorbs the risk the seller intended to transfer.
In today’s environment, that discipline is more consequential than ever. U.S. private credit defaults rose to 5.5% in Q2 2025, up from 4.5% in Q1, according to market data, while KBRA’s surveillance of over 1,900 middle market borrowers found that roughly 5% appeared most at risk of default heading into 2025 given fundamentally weak performance and limited financial flexibility. Understanding how to build a defensible, independently validated EBITDA bridge is the first line of defense.
The Normalization Framework: Four Layers of Adjustment
Institutional lenders do not accept a borrower’s adjusted EBITDA as a conclusion. They reconstruct it independently. The normalization framework operates across four distinct layers:
Layer 1 — Reported EBITDA (Baseline)
Start with audited or reviewed financials. Calculate EBITDA mechanically: Revenue − COGS − Operating Expenses + Depreciation & Amortization. For middle market companies, this figure is often unaudited and prepared on a tax basis—a meaningful distinction that requires reconciliation before any adjustment work begins. Trailing twelve months (LTM) is the standard measurement period; run-rate EBITDA projections based on anticipated but not yet realized conditions receive substantially less credit.
Layer 2 — Add-Backs (Upward Adjustments)
Common accepted add-backs include: (a) owner compensation above verified market replacement cost, (b) one-time transaction expenses directly tied to a completed sale process, (c) non-recurring legal costs where the underlying matter is fully resolved, and (d) COVID or force majeure disruptions with clear start and end dates. Critically, each add-back must be traceable to documentation, non-recurring by objective evidence, and would cease under new ownership. Verbal commitments or LOI-stage projections do not qualify.
Layer 3 — Add-Downs (Downward Adjustments)
This is the layer most sellers omit and most lenders should require. If the departing owner performed the CFO role, the cost of a market-rate replacement reduces normalized EBITDA. If rent is paid to a related party at below-market rates, normalized EBITDA must reflect a market-rate lease. If the business benefited from a favorable contract that will not survive ownership transfer, the revenue associated with that contract should be haircut or excluded.
Layer 4 — Lender’s Independent Underwriting EBITDA
After completing Layers 1–3, the lender applies its own credit judgment. Pro forma adjustments for acquisitions not yet closed, synergies the buyer will create, or cost savings dependent on post-closing actions all receive zero credit at underwriting. Debt is sized against the borrower’s independently verified EBITDA—not the sponsor’s investment thesis.
Working Example — $10M EBITDA Manufacturing Company
Line Item Amount Reported EBITDA (LTM) $7,900,000 (+) Owner comp above market replacement $500,000 (+) One-time legal costs (resolved, documented) $350,000 (+) Facility closure costs (non-recurring, supported) $250,000 (−) Market-rate CFO replacement cost ($200,000) (−) Below-market related-party rent normalized ($150,000) Lender-Underwritten Normalized EBITDA $8,650,000 Requested Debt $55,000,000 True Leverage (Lender Underwritten) 6.36x Illustrative example for analytical methodology purposes only.
Walking the Numbers: Calculations, Red Flags, and Stress Testing
The QoE Ratio: Cash Backing for Reported Earnings
Before accepting any EBITDA bridge, calculate the Quality of Earnings (QoE) ratio: Net Cash from Operating Activities ÷ Net Income. A ratio materially below 1.0x signals that reported earnings are not fully supported by actual cash generation—a structural red flag. Gaps may reflect timing differences or working capital investment, but also reveal aggressive revenue recognition, deferred expense reporting, or manipulation of accruals that inflate EBITDA without cash substance.
The 25–30% Add-Back Threshold
A critical heuristic used by experienced credit teams: when add-backs represent more than 25–30% of reported EBITDA, those adjustments require intense, independent scrutiny. Disproportionate bridges invite compression of legitimate adjustments—buyers and lenders who see ten borderline items often reduce more than those who see three clean ones. Credibility compounds; so does skepticism.
Stress Testing: The Three-Scenario Model
After establishing the lender’s normalized EBITDA, test it under three scenarios. In the Base Case, normalize for identified one-time items and apply current run-rate revenue. In the Downside Case, apply a 10–15% revenue haircut and hold margins flat—modeling a demand contraction without operational deterioration. In the Stress Case, apply a 20–25% revenue haircut and compress EBITDA margins by 200–300 basis points, reflecting both top-line pressure and fixed-cost deleverage. Map each scenario to interest coverage ratios (ICR) and leverage multiples. Any stress scenario that produces an ICR below 1.0x is a structural disqualifier at the underwriting stage, regardless of collateral support.
Structural Red Flags to Reject at First Review
- Add-backs relabeling recurring expenses as one-time: restructuring charges appearing in three of five historical years are operating costs, not exceptions.
- Pro forma revenue from an acquisition not yet closed or a contract not yet executed.
- Run-rate cost savings supported only by a letter of intent or management’s verbal commitment—not executed termination agreements or signed lease amendments.
- Any add-back that inflates EBITDA above 40% of GAAP net income without exceptional documentation.
- Owner compensation add-backs that fail to deduct the verified cost of a market-rate management replacement.
Institutional Standards: What the Data and the Market Tell Us
Credit Performance Context
Understanding why EBITDA normalization rigor matters requires grounding in actual credit performance data across cycles:
📊 Data Box: Credit Performance Benchmarks (2024–2025)
- U.S. High-Yield Default Rate (2025 Projection): 4.0%–4.5% per Fitch; Moody’s projected 3.2% for calendar year 2025, rising above 4% by Q1 2026. The historical average since 1996 is 4.5%. (Source: Moody’s Credit Strategy, July 2025; Fitch)
- Middle Market Payment Defaults (2024): KBRA observed only 21 payment defaults (1.1% by count) across 1,903 unique sponsor-backed middle market borrowers reviewed in full-year 2024. (Source: KBRA, Q4 2024 Middle Market Borrower Surveillance Compendium)
- Senior Direct Lending Loss Rate (2017–2025): Senior direct lending sustained losses of approximately 0.4% since 2017 per the Cliffwater Direct Lending Index – Senior (CDLI-S), compared to 1.1% for leveraged loans and 2.4% for high-yield bonds. (Source: Morgan Stanley, citing Cliffwater CDLI-S)
- CDLI Credit Losses (Q2 2025): Credit losses across the Cliffwater Direct Lending Index remained at 0.75% annually—below the long-term average of 1.01%. (Source: Cliffwater via Larry Swedroe, August 2025)
- Middle Market Borrowers with Sub-1.0x ICR (Q4 2025): 25% of borrowers tracked by KBRA carried a sub-1.0x interest coverage ratio—though this was the lowest share since Q3 2024. Median ICR held steady at 1.5x. (Source: KBRA, Q4 2025 Middle Market Borrower Surveillance Compendium)
- Covenant-Lite Penetration (Year-End 2024): 91.09% of outstanding U.S. leveraged loans—approximately $1.29 trillion in face value—were covenant-lite. 93% of all new institutional leveraged loan issuance in 2024 was covenant-lite. (Source: Resonanz Capital analysis, cited in Angel Investors Network)
What Experienced Lenders Require
The most rigorous institutional lenders impose an add-back cap: at least one major credit structure filed with the SEC in 2025 explicitly capped EBITDA add-backs for sub-$50M EBITDA obligors at 40% of non-adjusted EBITDA. This structural device forces borrowers to demonstrate that their earnings base is substantive before aggressive normalization inflates debt capacity.
Experienced mid-market lenders also distinguish between normalized EBITDA (sustainable, repeatable earnings under current ownership) and adjusted EBITDA (the broader bridge that may include buyer synergies and run-rate assumptions). The standard for credit underwriting is normalized EBITDA—what the business objectively earns, not what a new owner might eventually achieve. Debt is sized against the former; equity returns are underwritten against the latter.
The covenant-lite penetration data above carries a critical implication for EBITDA discipline at origination: in a market where 93% of broadly syndicated loan issuance carries no maintenance covenants, lenders have stripped away their early-warning systems. Without quarterly leverage or coverage maintenance tests, the first signal of EBITDA deterioration arrives when a borrower misses a payment—not six months earlier when financial cushion was eroding. This makes the accuracy of the origination-stage EBITDA calculation exponentially more important.
EBITDA Normalization Underwriting Checklist
The following step-by-step diligence framework should be applied independently by the lending team before any credit committee submission:
- Obtain Three Full Years of Audited/Reviewed Financials — Tax returns, management accounts, and auditor workpapers where available. Identify accounting basis (GAAP vs. tax) and reconcile.
- Calculate LTM EBITDA from Source Documents — Do not start from the borrower’s adjusted EBITDA schedule. Build from the income statement independently.
- Request the Full Adjustment Schedule with Supporting Documentation — For each add-back: (a) What is the nature of the item? (b) Why is it non-recurring? (c) What documentation supports removal? (d) Has this item appeared in prior periods?
- Apply the Recurrence Test — If the item appeared in more than one of the last three fiscal years, it is presumptively recurring. Require extraordinary evidence to accept as a one-time add-back.
- Apply the Market-Rate Replacement Test — For all owner compensation and related-party transactions, benchmark to market. Compute the net add-back after deducting replacement cost.
- Construct Your Own Normalized EBITDA Bridge — Include both add-backs and add-downs. Your bridge should be more conservative than the sponsor’s schedule.
- Calculate Three Leverage and Coverage Scenarios — Base, Downside, and Stress. Verify ICR remains above 1.0x in the Downside scenario. Stress scenario informs covenant headroom and amendment risk.
- Test Working Capital Dynamics — Separate run-rate earnings from normalized cash earnings. High EBITDA with deteriorating working capital signals an earnings quality problem even if the adjustment bridge is defensible.
- Document Your Independent EBITDA Conclusion — Credit memo must articulate the difference between the borrower’s adjusted EBITDA and the lender’s underwritten normalized EBITDA, with explicit rationale for every deviation.
Key Questions for Management During Diligence:
- “Walk me through every add-back that exceeds $100,000—what is the documentation, and when did the underlying event conclude?”
- “Has any of these line items appeared in prior-year financials or tax returns?”
- “What is the current CFO’s compensation relative to the market? Who performs this role post-closing?”
- “Are any related-party leases or service agreements at below-market rates? What are the arms-length terms?”
- “Which customers represent more than 10% of revenue? How are those contracts structured?”
Key Takeaways for Credit Practitioners
- ▶ Seller-provided EBITDA schedules are the starting point, not the conclusion. Institutional lenders independently reconstruct normalized EBITDA from source financials before underwriting debt capacity or calculating leverage multiples.
- ▶ Add-backs exceeding 25–30% of reported EBITDA are a structural red flag requiring exceptional documentation. In practice, aggressive bridges invite broader haircuts across both legitimate and borderline adjustments.
- ▶ Add-downs are as important as add-backs. Owner-dependent businesses require explicit cost normalization for management replacement, market-rate rent, and related-party services—adjustments that reduce EBITDA and are routinely omitted by sellers.
- ▶ The covenant-lite market makes origination-stage EBITDA accuracy the primary credit control. With 93% of new institutional leveraged loan issuance carrying no maintenance covenants in 2024, lenders no longer receive quarterly financial early warnings—making the accuracy of day-one normalized EBITDA the single most important underwriting variable.
- ▶ Stress test every deal before credit committee. A 15–25% revenue haircut stress scenario must be run against the lender’s independently derived EBITDA, not the borrower’s adjusted figure. Any scenario producing an ICR below 1.0x is a credit disqualifier at origination, regardless of collateral position or sponsor quality.


