
Underwriting & Risk Management • Credit Analysis
EBITDA Adjustments & Normalization: The Underwriter’s Framework for Building a Defensible Earnings Base
The Underwriting Challenge
A sponsor brings you a deal. The Confidential Information Memorandum leads with $12.4 million in “Adjusted EBITDA” — a figure derived from $8.1 million in reported GAAP earnings after 14 separate add-back items including a one-time ERP implementation, above-market owner compensation, a legal settlement, COVID-era relief receipts, and $1.8 million in “anticipated cost synergies” that haven’t yet materialized. The proposed structure: 5.0x leverage, first-lien senior secured, $62 million term loan.
The question isn’t whether the reported EBITDA can support that debt. The question is whether your underwritten EBITDA — the number you are willing to stake capital against — can support it after independent normalization.
This distinction is not academic. As practitioners across the credit markets have increasingly recognized, every dollar of adjusted EBITDA is multiplied by the deal’s valuation and leverage multiple. The stakes are compounding. A lender who accepts a borrower’s EBITDA schedule at face value is not underwriting a loan — they are financing a marketing document.
In today’s direct lending environment, where EBITDA definitions are padded with add-backs and forward-looking forecasts that give borrowers ample performance leeway, rigorous independent normalization is the first and most consequential act of underwriting discipline a lender can exercise.
The Analytical Framework: From Reported to Underwritten EBITDA
A Quality of Earnings (QoE) analysis is the institutional-grade methodology underpinning all EBITDA normalization in leveraged credit. It is not an audit. Unlike traditional financial audits, QoE analysis focuses on a fundamental question: “How confident can we be that these earnings will continue?” Audits verify historical compliance with GAAP; a QoE report assesses the economic substance and sustainability of earnings from a lender’s perspective.
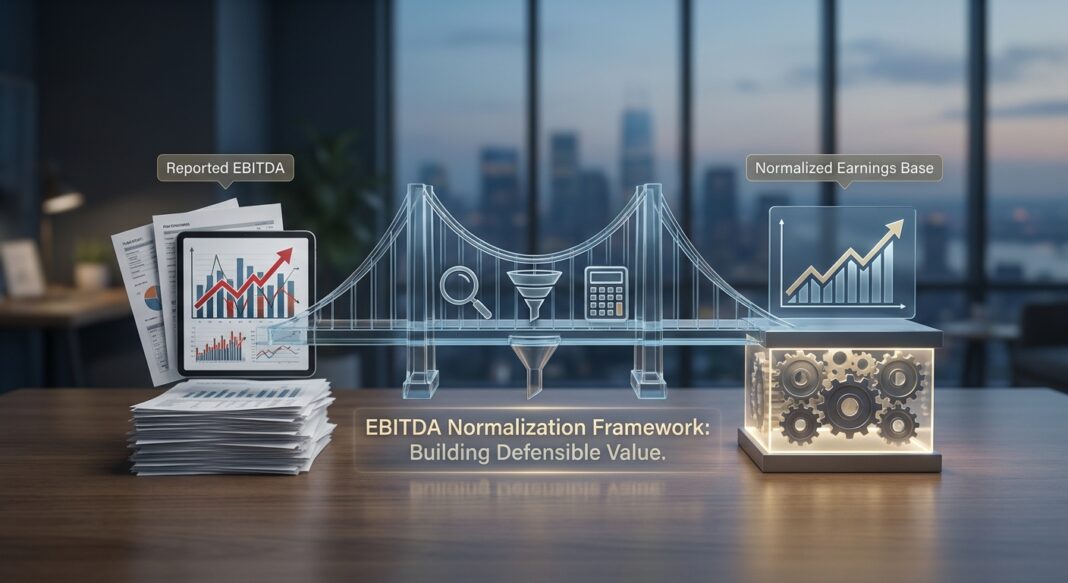
The normalization process constructs a three-step EBITDA bridge:
- Step 1 — Reported EBITDA: Begin with GAAP net income, adding back interest, taxes, D&A to arrive at reported EBITDA. This is your starting point, not your conclusion.
- Step 2 — Adjusted EBITDA (Seller’s View): The borrower or sponsor applies add-backs to remove items they characterize as non-recurring, non-cash, or non-operational. This is where discipline begins. Lenders underwrite acquisition financing based on Debt/EBITDA ratios and fixed charge coverage ratios, so inflated add-backs directly undermine supportable debt capacity.
- Step 3 — Normalized EBITDA (Lender’s View): The lender independently re-underwrites each add-back. Normalized EBITDA goes further than adjusted EBITDA to reflect the earnings a buyer can sustainably underwrite after considering steady-state staffing, market compensation, and necessary reinvestment. This is the number that drives the credit decision.
Example: Manufacturing Company, $10M Reported EBITDA
Consider a mid-market manufacturer with the following EBITDA bridge presented by the sell-side advisor:
| Item | Seller’s Add-Back | Lender’s Assessment | Accepted Amount |
|---|---|---|---|
| Reported EBITDA (GAAP) | $10,000,000 | Verified | $10,000,000 |
| Excess Owner Compensation | +$1,200,000 | Accept net of $350K market replacement cost | +$850,000 |
| One-Time Legal Settlement | +$600,000 | Accept — matter resolved, no recurrence risk | +$600,000 |
| ERP Implementation Cost | +$500,000 | Partially recurring — ongoing licensing reclassified | +$300,000 |
| Anticipated Cost Synergies | +$800,000 | Rejected — not yet implemented, not in run-rate | $0 |
| Related-Party Rent Normalization | +$240,000 | Accept at market-rate delta only | +$180,000 |
| Normalized EBITDA (Lender) | $13,340,000 | $11,930,000 |
The lender’s normalized EBITDA of $11.93M versus the seller’s $13.34M represents a $1.41M gap. At a 5.0x leverage multiple, that’s a $7.05M difference in supportable debt — not a rounding error.
The Analysis: Key Metrics and Stress Testing
Once a lender-underwritten normalized EBITDA is established, three primary credit metrics must be calculated and stress-tested before any credit approval:
1. Total Leverage Ratio (Debt / EBITDA)
Using our example above with a $62M term loan against $11.93M normalized EBITDA, the lender-calculated leverage ratio is 5.20x — materially above the 5.0x proposed by the sponsor using their inflated $12.4M EBITDA. Market context matters here: as of Q3 2025, middle market buyouts averaged sub-4.5x total debt-to-EBITDA, with first-lien leverage running at approximately 3.7x. A 5.2x first-lien structure on a manufacturer exceeds sector norms and warrants additional equity or structural subordination.
2. Debt Service Coverage Ratio (DSCR)
DSCR measures sustainable cash flow available to service debt obligations. The formula: Normalized EBITDA − CapEx − Cash Taxes − Working Capital Build ÷ Total Annual Debt Service (P+I). A ratio below 1.20x is a structural warning. Normalized EBITDA can be lower than adjusted EBITDA when the business requires additional costs under new ownership — a reality that DSCR analysis forces lenders to confront. Note that overly aggressive EBITDA normalization can cause DSCR to appear acceptable on paper but fail during underwriting.
3. Stress Scenario Analysis
Institutional lenders must test coverage under downside conditions. A standard stress matrix applies a 10–20% EBITDA haircut alongside a 50 bps rate increase. S&P’s mild stress scenario — a 10% EBITDA drop and 50-basis-point rate hike — pushes over 25% of firms below 1x coverage, signaling distress. In our example, a 15% EBITDA stress reduces normalized earnings to $10.14M. Against $62M of floating-rate debt at current all-in yields, free cash flow coverage compresses dangerously. That’s the actual risk the borrower is bringing to the table.
Industry Standards: What Institutional Lenders Require
The private credit market has grown to an asset class exceeding $2 trillion in AUM, with private credit funding over 80% of all LBO transactions in 2024. With that scale has come growing tension between competitive deal pressure and underwriting discipline.
The Add-Back Problem at Scale
Lender competition has materially loosened documentation standards in recent years. Because expansive add-backs can materially affect leverage outcomes, lenders often impose caps — including shared caps expressed as a percentage of EBITDA — on projection-based or nonrecurring adjustments to reflect actual operating cash flows. This is a best practice that protects against EBITDA inflation eroding leverage covenant integrity.
The bridge between Reported and Adjusted EBITDA is no longer just a meme-worthy punchline — it’s a red flag in the eyes of investors and diligence teams that demands proactive scrutiny. Sellers who treat adjusted EBITDA as a marketing exercise rather than an underwriting exercise consistently lose credibility and deal leverage during diligence.
Common Red Flags in EBITDA Normalization
- Recurring items labeled as one-time: Relabeling ongoing costs as one-time is among the most common normalization pitfalls — particularly around IT, maintenance, and professional services.
- Unadjusted owner compensation: Lenders must ensure executive compensation aligns with market standards before crediting any add-back.
- Forward synergies in the base case: Anticipated cost savings should be rejected if they depend on post-closing actions.
- Revenue concentration risk embedded in run-rate: A single customer representing >20% of revenue inflates the EBITDA base with non-diversified risk — credit-adjust accordingly.
- Stock-based compensation added back: Many PE buyers exclude SBC when calculating debt capacity, because lenders underwriting leverage ratios should not extend credit against earnings inflated by adding back genuine compensation costs.
📊 Credit Performance Data Box
- Middle Market Leverage (Q3 2025): Average debt-to-EBITDA for middle market buyouts was sub-4.5x, with first-lien at 3.7x and unitranche at 5.5x (LSEG LPC, Q3 2025).
- Private Credit Default Rate: The Cliffwater Direct Lending Index (CDLI) trailing 12-month default rate through June 2025 was 1.45%, versus approximately 3.37% for broadly syndicated loans over the same period.
- Leveraged Loan Default Rate: S&P Global Ratings forecast the U.S. leveraged loan default rate to rise to 1.6% through December 2025, reflecting a slight increase from 1.5% in December 2024 (S&P Global Ratings, March 2025).
- Middle Market Stress Exposure: KBRA identified approximately 5% of monitored middle-market sponsored borrowers as most at risk of default in 2025, citing prolonged elevated base rates and fundamentally weak performance (KBRA, Q4 2024 Surveillance Compendium).
- Covenant Erosion: Covenant-lite structures reached 21% of direct lending transactions in 2025, up from just 4% in 2023, underscoring why independent EBITDA normalization is now the primary lender protection in many deals.
- Moody’s Recovery Rates: Moody’s published loan recovery rate is approximately 60%, implying annual credit losses of roughly 2.8% at a 7% default rate. Recovery assumptions must be stress-tested at the collateral level, not the index level.
The EBITDA Normalization Underwriting Checklist
The following step-by-step diligence process should be applied to every credit underwriting where adjusted EBITDA drives the leverage and coverage analysis:
Phase 1 — Document Collection
- ☐ Three years of audited or reviewed financial statements (CPA-compiled minimum)
- ☐ Trailing twelve months (TTM) management accounts with monthly breakout
- ☐ Detailed general ledger access for all add-back line items
- ☐ Bank statement reconciliation to verify revenue is cash-backed
- ☐ Payroll records and compensation agreements for all owners and key executives
- ☐ All related-party contracts (leases, management agreements, intercompany loans)
Phase 2 — EBITDA Bridge Construction
- ☐ Build an independent EBITDA bridge from reported net income to normalized EBITDA
- ☐ Evaluate each seller add-back against the three tests: Is it truly non-recurring? Is it documented? Would it disappear under new ownership?
- ☐ Apply market-rate replacement cost analysis to all owner/key-person compensation adjustments
- ☐ Reject all forward synergies, unapproved cost savings, or forecasted price increases not yet in the run-rate
- ☐ Document accepted vs. rejected add-backs with supporting evidence for the credit committee
Phase 3 — Coverage and Leverage Analysis
- ☐ Calculate Total Debt / Normalized EBITDA (lender’s view) and compare to sector benchmarks
- ☐ Calculate DSCR using free cash flow after maintenance CapEx, taxes, and working capital requirements
- ☐ Run a minimum of three stress scenarios: base case, 10% EBITDA stress, 20% EBITDA stress with 50 bps rate increase
- ☐ Confirm DSCR ≥1.20x in base case and ≥1.00x in the moderate stress scenario
Phase 4 — Revenue and Customer Quality Diligence
- ☐ Analyze revenue by customer concentration — flag any single customer >20% of revenues
- ☐ Review customer contract terms, renewal history, and churn data for the trailing 24 months
- ☐ Assess gross margin trend by product or service line to identify compression risk
- ☐ Verify that revenue recognized aligns with cash collection patterns (proof-of-cash analysis)
Questions to Ask Management
- ☐ “Walk me through each add-back item with the underlying invoices or journal entries.”
- ☐ “Which costs will change under new ownership and in what direction?”
- ☐ “What is the steady-state CapEx requirement to maintain current revenue capacity?”
- ☐ “Have there been any changes in accounting policies in the last three years?”
Key Takeaways
- 🔹 Never accept the seller’s EBITDA schedule as the underwriting base. Independent normalization is not a formality — it is the first and most consequential act of credit discipline. Seller-provided schedules are a starting point, not a conclusion.
- 🔹 Every add-back must pass three tests: non-recurring, documented, and ownership-independent. Anticipated synergies, recurring costs relabeled as one-time, and above-market owner comp unadjusted for replacement cost are the most common sources of EBITDA inflation in middle-market transactions.
- 🔹 The gap between seller EBITDA and lender EBITDA is multiplied by the leverage ratio. A $1M add-back differential at 5.0x leverage means $5M of debt that may not be serviceable. Structural errors compound at the point of stress.
- 🔹 Stress-test coverage before you stress-test price. With S&P data showing that a mild 10% EBITDA decline pushes over 25% of leveraged firms below 1x coverage, lenders must build downside scenarios into the initial underwrite — not as a sensitivity, but as a credit condition.
- 🔹 Covenant erosion has transferred risk to the underwriting process. With covenant-lite structures now representing over 21% of direct lending deals — up from 4% in 2023 — traditional maintenance covenants can no longer be relied upon as an early-warning system. The quality of upfront normalization is now the lender’s primary protection.


