
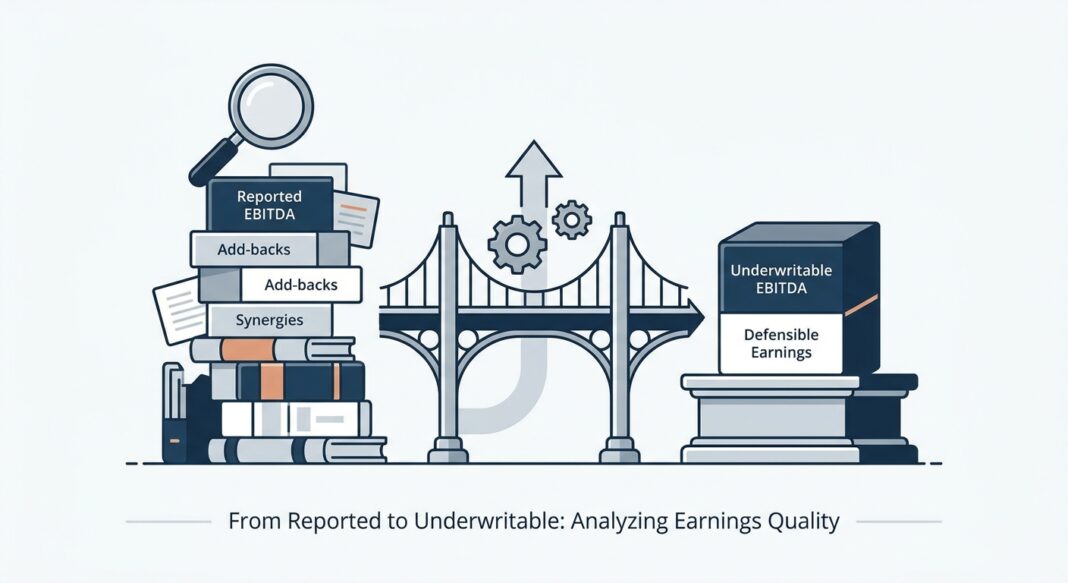
The Underwriting Question Every Deal Demands
Here is the scenario: A sponsor presents a confidential information memorandum (CIM) for a $10 million EBITDA manufacturing company. The cover page is clean, the growth story is compelling, and the proposed debt structure sits at 4.5x leverage. But buried in the financial schedules is a 31% gap between reported EBITDA and adjusted EBITDA — a bridge built on owner compensation add-backs, one-time legal settlements, COVID-era cost eliminations, and projected cost synergies that have yet to materialize.
Which number do you lend against?
This is the central challenge of credit underwriting in middle-market direct lending. Sellers must present Adjusted EBITDA with evidence-based normalization adjustments to build trust with buyers and maintain credibility in competitive deal processes. But for a lender, the stakes are asymmetric: an inflated earnings base understates leverage, overstates coverage ratios, and sets covenant thresholds against a number the business may never organically produce. Every dollar of inflated or unjustified Adjusted EBITDA has a disproportionate impact on valuation and deal returns. Understanding what belongs in normalized EBITDA — and what must be rejected — is the foundational discipline of rigorous credit underwriting.
The Analytical Framework: From Reported to Underwritable EBITDA
Experienced credit underwriters treat the seller’s adjustment schedule as a starting point, not a conclusion. Lenders independently evaluate normalized EBITDA during underwriting. Seller-provided schedules are viewed as a starting point, not a conclusion. The goal is to arrive at what practitioners call underwritable EBITDA — the earnings figure a lender is willing to extend leverage against because it reflects the business’s true, sustainable, post-close cash generation.
Many practitioners use the terms interchangeably, but buyers often think of adjusted EBITDA as the bridge from reported financials to a cleaned-up earnings number, and normalized EBITDA as the earnings a buyer can sustainably underwrite after considering the full operating reality, including steady-state staffing, market compensation, and necessary reinvestment.
The framework operates in three passes:
- Pass 1 — Gross Normalization: Add back documented, non-recurring items (transaction costs, one-time litigation, terminated contracts). These are the least contested adjustments when properly supported.
- Pass 2 — Owner-Specific Adjustments: Replace above-market owner compensation with a market-rate management salary. Excess owner compensation may be accepted only after deducting the market cost of replacing the owner’s operating role.
- Pass 3 — Lender Haircuts: Apply independent judgment to forward-looking or synergy-based add-backs. Anticipated cost savings may be rejected if they depend on post-closing actions. Run-rate items only receive credit if already reflected in trailing period invoices and customer data.
The output is a fully documented EBITDA bridge — a line-by-line reconciliation from reported financials to the lender’s underwritable figure. Lenders may request a bridge among historical EBITDA, QoE-adjusted EBITDA, covenant EBITDA, and the figure used in the buyer’s model.
Example: Analyzing a $10M EBITDA Manufacturing Company
| Adjustment Item | Seller Claim | Lender Accepted | Rejected / Haircut | Rationale |
|---|---|---|---|---|
| Reported EBITDA | $7.10M | $7.10M | — | Base figure from audited financials |
| Owner compensation excess | +$1.20M | +$0.75M | –$0.45M | Market replacement salary deducted |
| One-time legal settlement | +$0.40M | +$0.40M | — | Documented, resolved, non-recurring |
| Projected cost synergies | +$0.85M | $0 | –$0.85M | Not in run rate; post-close dependent |
| Non-cash stock comp | +$0.30M | $0 | –$0.30M | Real compensation cost; lender excluded |
| Personal travel & entertainment | +$0.15M | +$0.15M | — | Documented, clearly personal, verifiable |
| Seller Adjusted EBITDA | $10.00M | — | — | — |
| Lender Underwritable EBITDA | — | $8.40M | –$1.60M | Haircut of 16% from seller claim |
Illustrative example for educational purposes. Dollar amounts are hypothetical and used solely to demonstrate underwriting methodology.
Note the impact: at 4.5x leverage against seller EBITDA, the debt load is $45M. Against the lender’s underwritable figure of $8.4M, implied leverage rises to 5.36x — a material difference that changes risk pricing, covenant levels, and the credit decision itself. The buyer-underwritten normalized EBITDA is meaningfully below the seller’s adjusted figure. At an 8.0x multiple, a $320,000 difference represents $2.56 million of enterprise value. The example shows why adjustment quality matters as much as the headline multiple.
The Analysis: Calculating Coverage and Identifying Stress Points
Once underwritable EBITDA is established, the lender must map it to the three credit ratios that govern the structure:
- Total Leverage Ratio (Debt / EBITDA): Measures the debt load relative to earnings. Common covenant examples include a Leverage Ratio (e.g., debt-to-EBITDA must not exceed 5.0x) and an Interest Coverage Covenant (e.g., EBITDA must cover interest payments by at least 2.0x).
- Fixed Charge Coverage Ratio (FCCR): The FCCR measures whether operating cash flow covers all fixed obligations — interest, principal, taxes, and capex. The FCCR answers a specific question: for every dollar of unavoidable, recurring financial obligation a business carries, how many dollars of cash flow are available to cover it? Most lenders set a minimum FCCR covenant somewhere between 1.1x and 1.5x, depending on the loan type, industry, and revenue volatility.
- Interest Coverage Ratio: Covenant packages may include a fixed charge coverage ratio, which measures the ability of EBITDA (adjusted for unfinanced capital expenditures and other cash outlays) to service interest payments and other fixed charges such as scheduled amortization.
Continuing the manufacturing example: Against $8.4M underwritable EBITDA with $45M in debt at a blended rate of 8.5% (approximately $3.83M in annual interest), the interest coverage ratio is 2.19x — thin but workable. Strip out $1.5M in maintenance capex and $1.8M in required principal amortization, and the FCCR drops to 0.96x — below the standard 1.1x floor and a deal-breaking signal at original pricing.
This is precisely the type of stress hidden inside aggressive EBITDA schedules. If EBITDA normalization is overly aggressive, DSCR may appear acceptable on paper but fail during underwriting. This is one of the most common reasons deals stall or collapse.
Covenant cushion analysis is equally critical. A typical leverage covenant in a direct lending transaction may be set with a 25–35% cushion to the EBITDA projected in a sponsor or borrower model prepared and delivered to the lender prior to closing. If the covenant is set against seller EBITDA rather than lender-underwritten EBITDA, that cushion is illusory.
Industry Standards: What the Data Says About Add-Back Risk
The consequences of accepting inflated EBITDA are now measurable across the private credit market. Credit performance data from multiple sources paints a consistent picture of elevated stress in deals where underwriting discipline was compromised.
📊 Credit Performance Data Box
- Private Credit Default Rate (2025): Moody’s analysis suggests the private credit default rate in 2025 likely ranged between 1.6% and 4.7%, depending on whether distressed exchanges are included.
- Distressed Exchanges Dominate: Distressed restructurings accounted for approximately 65% of all defaults in 2025, materially influencing how default risk is measured across private markets.
- Leveraged Loan Market: As of August 31, 2025, the trailing 12-month default rate for conventional payment defaults in the U.S. leveraged loan market stood at 1.36%, with the combined rate including distressed LMEs significantly higher at 4.37% as tracked by issuer count.
- Interest Coverage Stress: KBRA’s Q4 2025 borrower surveillance, based on 3,649 middle market corporate credit assessments covering over $1 trillion in private direct lending debt, found that one borrower in four had a sub-1.0x interest coverage ratio — generating less cash than required to cover interest expense.
- EBITDA Add-Back Prevalence: According to Pepperdine’s 2025 Private Capital Markets Report, roughly 76% of lower middle market valuations use the recast (adjusted) EBITDA figure. The typical reported-to-adjusted gap runs 20–30% of EBITDA, and wider gaps signal aggressive add-backs that buyers will challenge in due diligence.
- Covenant Erosion Risk: The Cliffwater Direct Lending Index posted a 9.3% net return in 2025 with a 1.45% default rate — but 91% of the underlying loans have effectively no covenant protection.
- AUM Growth & Structural Risk: Private credit has continued to expand rapidly, with corporate lending AUM expected to exceed $2 trillion in 2026 and grow toward $4 trillion by end of decade. That growth has been accompanied by structures that can obscure underlying leverage, including covenant-lite documentation and payment-in-kind (PIK) income.
The most telling statistic for underwriters: falling default rates are real and welcome, but the composition of those defaults — heavily weighted toward soft credit events that often defer rather than resolve underlying stress — means the improvement in headline numbers may be slower and more fragile than it appears. For credit professionals in private markets, this is a moment that rewards issuer-level diligence over top-down optimism.
On the covenant side, the market structure has introduced a new layer of underwriting risk. The early-warning mechanism from maintenance covenants is largely gone in covenant-lite structures — lenders find out a borrower is in trouble when they stop paying, not six months before when a leverage test would have flagged it.
The most common red flags that experienced underwriters screen for:
- Adjustment stacking: Multiple small add-backs aggregating to more than 25% of reported EBITDA with limited documentation.
- Recurring "one-time" items: Recurring expenses dressed up as one-time are the most common rejected add-back category in QoE review.
- Synergy-forward adjustments: Cost savings or revenue uplift that requires post-closing management action.
- Covenant EBITDA divergence: In today’s deal environment, buyers are demanding a more robust due diligence standard grounded in defensible metrics, and seller EBITDA normalization adjustments are under sharper scrutiny.
- Stock-based compensation exclusion: Many lenders exclude SBC when calculating debt capacity, because leverage ratios should not extend credit against earnings inflated by adding back genuine compensation costs.
Underwriting Diligence Checklist: EBITDA Normalization
The following step-by-step checklist represents the standard of care for credit underwriters evaluating adjusted EBITDA in a middle-market financing:
✅ Documentation & Sourcing
- Obtain three years of audited or reviewed financial statements plus trailing twelve months (TTM) management accounts
- Request a fully itemized EBITDA bridge from reported to adjusted — line-by-line, with dollar amounts and explanations
- Cross-reference every add-back to source documents: invoices, board resolutions, legal correspondence, payroll records
- Confirm that the QoE report (if provided) was prepared by a nationally or regionally recognized accounting firm
✅ Add-Back Evaluation
- Classify each adjustment: non-recurring vs. recurring, cash vs. non-cash, documented vs. projected
- Apply a zero-tolerance policy on synergy add-backs without clear pre-close implementation evidence
- Apply the traceability test: can the adjustment be traced to records? Is the rationale clear? Would the cost truly disappear or change under new ownership?
- Independently verify owner compensation market replacement costs using compensation surveys (e.g., Radford, Mercer)
- Scrutinize related-party transactions — lenders scrutinize discretionary expenses, ensure executive compensation aligns with market standards, and verify that related-party transactions, such as below-market rent, are adjusted to reflect actual economics.
✅ Ratio Construction & Covenant Setting
- Build the leverage ratio, FCCR, and interest coverage on lender-underwritten EBITDA — never seller-adjusted EBITDA
- Model a minimum 25–30% covenant cushion to lender underwritten EBITDA at close
- Run a downside case: What does EBITDA look like if the top two add-backs are reversed? Does the deal still work?
- Ensure covenant definitions in the credit agreement track consistently with underwritten EBITDA — not a more permissive contractual definition
✅ Stress Testing Questions
- What is the FCCR if EBITDA declines 15% in Year 1? Does it breach the 1.1x floor?
- What customer concentration risk exists, and what is the revenue impact of losing the top customer?
- Are working capital assumptions consistent with the industry’s historical cash conversion cycle?
- Is capex maintenance-only, or is growth capex baked into EBITDA projections?
Key Takeaways for Credit Underwriters
- Treat every EBITDA bridge as a negotiation, not a gift. Seller-adjusted EBITDA is an opening position. Lender underwritable EBITDA is the only figure that belongs in a credit memo, leverage calculation, or covenant structure.
- The gap between reported and adjusted EBITDA is itself a risk signal. Adjustments representing more than 20–25% of reported EBITDA demand heightened scrutiny and documentation requirements before any dollar receives credit.
- Covenant thresholds must be anchored to underwritten, not projected, earnings. Setting covenants against a sponsor’s model EBITDA rather than the lender’s own figure eliminates the early-warning function that maintenance covenants are designed to provide.
- Distressed exchanges are the new default. With distressed restructurings accounting for approximately 65% of all credit events in 2025, lenders must distinguish between deals that are truly performing and those that are simply avoiding hard default through amendment, PIK toggling, or maturity extension.
- Issuer-level diligence is non-negotiable in the current environment. With a material share of middle-market borrowers operating at sub-1.0x interest coverage, the market no longer rewards top-down optimism. Rigorous, independent EBITDA normalization is the first — and most consequential — line of credit defense.


