
Underwriting & Risk Management — Bond Capital
July 12, 2026
The Number That Makes or Breaks a Credit Decision
A sponsor-backed manufacturer enters your pipeline with a Confidential Information Memorandum projecting $10.2 million in Adjusted EBITDA. The proposed debt load is $55 million — a 5.4x leverage multiple that sits at the outer edge of your credit policy. Management’s adjusted EBITDA schedule is 23 lines long. Eleven of those lines are add-backs.
This is the central underwriting challenge of modern private credit: the number you are asked to lend against and the number the business actually produces are rarely the same thing. The difference between them — built line-by-line through adjustments, normalizations, and run-rate projections — determines whether your loan is well-structured or dangerously mispriced from day one.
Institutional lenders, private equity sponsors, and independent advisors now operate under a shared understanding that reported EBITDA in a privately held company almost always reflects the owner’s personal financial decisions as much as underlying business performance. Normalization corrects for those distortions. But normalization can also be weaponized. In today’s deal environment, buyers and lenders are demanding a more robust due diligence standard, grounded in defensible metrics, and any bridge between reported and adjusted EBITDA that cannot survive independent scrutiny is a credit risk waiting to materialize.
This article walks through a complete underwriting framework for EBITDA normalization: the methodology, the arithmetic, the red flags, and the diligence checklist that experienced lenders apply before accepting any earnings figure as the basis for debt sizing.
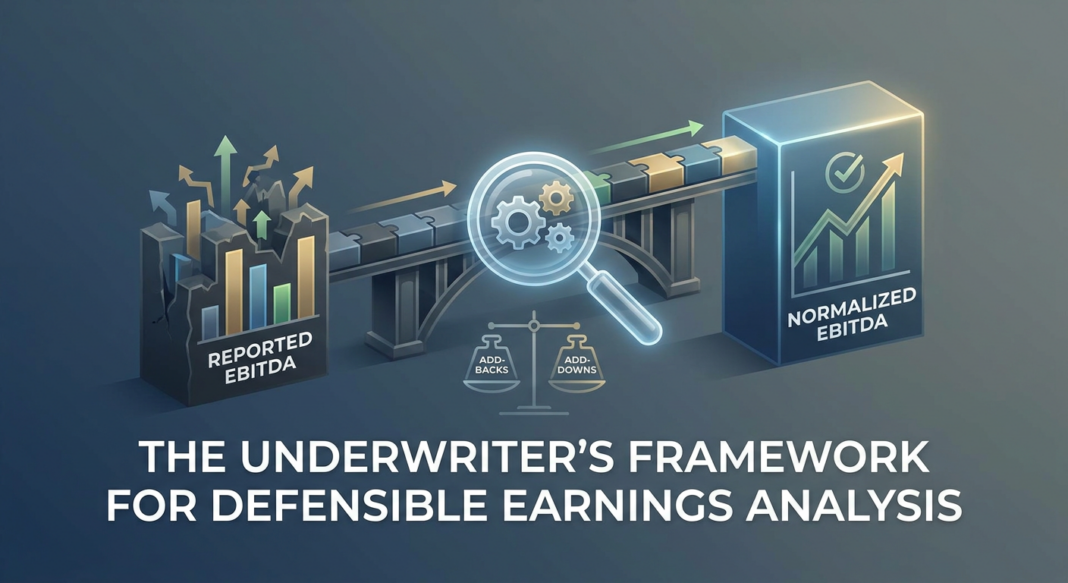
The Normalization Framework: From Reported to Lender-Accepted EBITDA
Credit underwriters distinguish between three related but meaningfully different numbers:
- Reported EBITDA — the raw figure from audited or reviewed financial statements, before any adjustments.
- Adjusted EBITDA — the earnings figure after management’s proposed add-backs are applied, typically presented in a CIM. Buyers often think of this as the bridge from reported financials to a cleaned-up earnings number after removing one-time and non-operating items.
- Normalized EBITDA — the earnings a buyer or lender can sustainably underwrite after considering steady-state staffing, market compensation, and necessary reinvestment. This is the figure a lender ultimately lends against. It frequently differs from management’s adjusted EBITDA.
The standard normalization formula is straightforward:
Normalized EBITDA = Reported EBITDA

        ± Owner Compensation Adjustment

        + Personal Expense Add-Backs

        + One-Time Cost Add-Backs

        − One-Time Revenue Items

        ± Rent / Related-Party Normalization

        − Mandatory Cost Add-Downs (understated expenses)
The practitioner’s standard is traceability and reasonableness: can every adjustment be traced to records, is the rationale clear, would the cost truly disappear under new ownership, and is the adjustment consistent with how the business will operate after closing? The most common legitimate add-backs in lower middle-market transactions include:
- Excess owner compensation above a documented market replacement cost
- Owner perks and discretionary personal expenses run through the business
- One-time legal settlements where the underlying matter is fully resolved
- Transaction-related advisory and legal expenses directly tied to the sale process
- Non-recurring severance and restructuring charges
- Related-party rent or management fee normalization to market-rate equivalents
Critically, the normalization process also runs in reverse. Lenders must apply add-downs when the business is benefiting from below-market rent paid to a related party, when the owner is underpaid relative to a market replacement salary, or when capital expenditures have been deferred and must be reinstated in the run-rate. A credible normalized EBITDA schedule therefore includes both add-backs and add-downs, even though sellers tend to present only the add-back side.
“Anticipated cost savings may be rejected if they depend on post-closing actions.”
The Analysis: Walking Through a $10M EBITDA Manufacturing Credit
Consider a Midwest metal-fabrication company. Management presents the following adjusted EBITDA schedule to support a $55M senior secured term loan:
| Line Item | Management Position | Lender Assessment | Variance |
|---|---|---|---|
| Reported EBITDA (TTM) | $7,800,000 | $7,800,000 | — |
| Owner compensation normalization | +$950,000 | +$620,000 | −$330,000 |
| One-time legal settlement (resolved) | +$400,000 | +$400,000 | — |
| Transaction advisory fees | +$275,000 | +$275,000 | — |
| Proposed cost savings (headcount reduction) | +$500,000 | $0 | −$500,000 |
| Related-party rent (below-market) | $0 | −$180,000 | −$180,000 |
| Deferred maintenance add-down | $0 | −$120,000 | −$120,000 |
| Normalized EBITDA | $9,925,000 | $8,795,000 | −$1,130,000 |
The arithmetic consequences are immediate and significant. At a 5.4x leverage multiple, the $1.13M EBITDA gap means the lender is underwriting $6.1M more debt than the business’s sustainable cash flow supports. At an 8.0x valuation multiple, a $320,000 adjustment discrepancy alone represents $2.56 million of misvalued enterprise value — a figure that flows directly into collateral coverage and loss-given-default calculations.
The most critical rejected item here is the proposed cost savings add-back. The headcount reduction had not yet been implemented at close; it depended entirely on post-closing management decisions that remained unexecuted. This is among the most consistently rejected categories in lender underwriting: future synergies and unimplemented cost actions belong in the upside case of a financial model, not in the EBITDA base used for debt sizing.
Running standard credit metrics against the lender-accepted figure:
- Total Leverage: $55M ÷ $8.795M = 6.25x (vs. 5.4x on management’s EBITDA) — above typical 6.0x senior threshold
- Interest Coverage (DSCR): $8.795M ÷ ~$4.5M annual interest (at ~8.2% all-in) = 1.95x — thin by institutional standards
- Free Cash Flow Conversion: If EBITDA-to-FCF conversion is 70%, available cash for debt service ≈ $6.15M — meaning one revenue disruption quarter compresses coverage materially
This is exactly the scenario where stress testing becomes non-negotiable. A 15% EBITDA haircut (consistent with a mild demand contraction) reduces normalized earnings to approximately $7.5M — dropping interest coverage below 1.65x and triggering a financial covenant breach under standard maintenance covenants.
What Institutional Lenders Are Seeing: Standards, Red Flags & Credit Data
The Tightening Underwriting Environment
The current credit environment has materially changed how institutional lenders approach EBITDA normalization. Limited partners at PE funds are demanding greater transparency, and lenders are tightening underwriting standards in response to the macro environment. Evidence-backed adjusted EBITDA and achievable synergies have become a prerequisite, not a preference. Lenders independently evaluate normalized EBITDA during underwriting — seller-provided schedules are treated as a starting point, not a conclusion.
The QoE process has become a near-universal requirement at institutional scale. Over 70% of M&A transactions now require formal financial due diligence QoE, and within buy-side financial due diligence engagements, Quality of Earnings analysis typically represents approximately 30% of total diligence effort, making it the single largest workstream. Material QoE findings typically reprice deals 5 to 15%, with extreme cases reaching 30%+ or deal termination.
Top Red Flags That Trigger Lender Scrutiny
Experienced credit underwriters consistently flag the following patterns as high-risk add-back scenarios:
- Recurring “non-recurring” costs — legal fees, severance, or system costs that appear in two or more trailing periods
- Unimplemented cost savings — add-backs predicated on post-closing headcount, vendor, or lease decisions
- Customer concentration without contracted revenue — top customer >25% of revenue with no long-term agreement
- EBITDA-to-cash conversion below 70% over a 3-year trailing average, signaling working capital stress or hidden capital intensity
- Capitalized costs growing faster than revenue — a signal of earnings inflation through aggressive capitalization of operating expenses
- Q4 revenue spikes followed by Q1 returns — classic channel-stuffing patterns that inflate the TTM EBITDA base
- Related-party transactions at non-arm’s-length terms — below-market rent, intercompany management fees, or family payroll that are systematically under-normalized
📊 Credit Performance Data Box
- Private Credit Default Rate (2025): Moody’s estimates the private credit (direct lending) default rate ranged between approximately 1.6% and 4.7% in 2025, depending on whether distressed exchanges are included — a wide band that reflects the opacity of the asset class. (Source: Moody’s Ratings, May 2026)
- Distressed Exchange Dominance: Approximately 65% of all corporate defaults in 2025 were distressed restructurings — workouts, indenture modifications, and debt-for-equity swaps — rather than hard payment defaults. This proportion equals the highest annual share on record. (Source: Moody’s Ratings, July 2025)
- Leveraged Loan Default Rate: For leveraged loan issuers, default rates in mid-2026 are running nearly double the 3.4% historical average. The leveraged loan default rate was projected to reach 7.5% by year-end 2025, with continued elevation through Q2 2026. (Source: Moody’s Credit Strategy Report, July 2025)
- First-Lien Recovery Rates: Moody’s estimates expected ultimate recoveries on U.S. first-lien loans at roughly 68%, down from long-run historical experience in the high 70s. For base-case credit modeling, a 60–70% first-lien recovery assumption is currently defensible; rating agencies apply 45–60% in AAA stress scenarios. (Source: Moody’s Default & Recovery Database; CLO credit model analysis, 2024–2026)
- Smaller Companies, Higher Risk: Moody’s EDF-X data shows that smaller companies carry relatively more high and severe early-warning signals than larger companies — a consistent finding that underscores the importance of granular, issuer-level EBITDA validation in lower middle-market lending. (Source: Moody’s EDF-X, Q2 2025)
- Sell-Side QoE Premium: Per GF Data/ACG (Fall 2025), transactions with a sell-side Quality of Earnings report closed at a median 7.4x TEV/EBITDA vs. 7.0x without — a 5.7% valuation premium, reflecting that lender-ready EBITDA documentation directly influences both pricing and deal certainty. (Source: GF Data / ACG Middle-Market M&A Study, Fall 2025)
The Covenant Connection
Private credit loans frequently carry tighter financial maintenance covenants than broadly syndicated alternatives, including maximum leverage and minimum EBITDA maintenance provisions that can trigger earlier lender engagement when performance weakens. This structural advantage is only meaningful if the EBITDA baseline embedded in those covenants is accurate. An inflated normalized EBITDA creates falsely generous headroom, converting a maintenance covenant from a protection mechanism into a fiction. Lenders who accept management’s EBITDA at face value set covenants against a number the business may never actually achieve.
The EBITDA Normalization Underwriting Checklist
The following step-by-step framework reflects institutional diligence standards for credit underwriters evaluating a normalized EBITDA schedule presented in a CIM or loan package.
Step 1 — Source Document Collection
- ☐ Obtain 3 full fiscal years of audited or reviewed financial statements plus the trailing twelve-month period
- ☐ Request detailed monthly trial balances for the analysis period to identify seasonality and anomalies
- ☐ Obtain management’s internal monthly reporting packages, board presentations, and any prior-year budgets vs. actuals
- ☐ Request the full chart of accounts to identify non-standard expense classifications
Step 2 — Revenue Quality Assessment
- ☐ Confirm revenue recognition policies are consistent with ASC 606 across all periods
- ☐ Decompose revenue changes into pricing vs. volume to test sustainability of growth claims
- ☐ Analyze deferred revenue balance and waterfall for pull-forward or timing risks
- ☐ Map customer concentration: flag any single customer >20% of revenue or top-5 customers >50% without contracted terms
- ☐ Test for Q4 revenue spikes inconsistent with operations; trace to customer invoicing records
Step 3 — Add-Back Validation (Line-by-Line)
- ☐ For each proposed add-back, require primary source documentation: invoices, board resolutions, legal closing letters, W-2s
- ☐ Owner compensation: compare actual draw/salary/benefits to a compensation survey benchmark for the role; add back only verified excess above market replacement cost
- ☐ Legal costs: confirm the underlying matter is fully resolved with no ongoing exposure or appeal risk
- ☐ Transaction fees: verify line items are directly tied to this sale process, not general advisory retainers
- ☐ Reject all add-backs predicated on post-closing actions (unimplemented headcount reductions, vendor renegotiations, or lease exits not yet executed)
- ☐ Cross-check every add-back against the trailing 3-year history: any item appearing in two or more periods is likely recurring
Step 4 — Add-Down Identification
- ☐ Related-party rent: obtain a current market comparable from an independent broker; apply the delta as an add-down
- ☐ Deferred maintenance and capex: obtain a capital expenditure schedule; normalize annual reinvestment to management’s own stated maintenance capex figure if below industry norms
- ☐ Insurance coverage: verify the business carries adequate D&O, liability, and key-person coverage; add-down for any identified gaps
- ☐ Underpaid owner or management: if the owner’s current salary is below market, lender must reduce normalized EBITDA to reflect what a true market-rate replacement would cost
Step 5 — Credit Metric Calculation & Stress Testing
- ☐ Calculate Total Leverage (Total Debt ÷ Lender-Accepted Normalized EBITDA); flag any result >5.5x for additional scrutiny
- ☐ Calculate DSCR (Normalized EBITDA ÷ Annual Debt Service); institutional minimum is typically 1.20x–1.25x; flag anything below 1.50x in cyclical industries
- ☐ Run a 15% EBITDA stress scenario: if coverage falls below 1.10x or leverage exceeds 7.0x, require additional structural protection (cash sweeps, springing covenants, equity cure rights)
- ☐ Reconcile EBITDA to cash flow: EBITDA-to-FCF conversion below 70% over 3 years requires working capital deep-dive and liquidity buffer covenant
Step 6 — Documentation for Credit Committee
- ☐ Build a formal EBITDA bridge: Reported EBITDA → Management Adjusted EBITDA → Lender-Accepted Normalized EBITDA, with variance explanation for each rejected or modified add-back
- ☐ Attach primary source documents for every accepted add-back exceeding $50,000
- ☐ Document the covenant setting rationale: show the headroom between lender-accepted EBITDA and the first covenant trigger in the base case and the stress case
Key Takeaways for Credit Underwriters
- The accepted EBITDA is the most consequential number in a credit decision. Every dollar of inflated or unjustified adjusted EBITDA has a disproportionate impact on leverage, coverage, and ultimately, loss severity in a default scenario. At a 5.5x debt multiple, a $1M EBITDA overstatement translates to $5.5M of excess debt relative to true cash flow support.
- Seller-provided add-back schedules are a starting point, not a conclusion. Institutional lenders conduct independent normalization, requiring primary-source documentation for every material adjustment. Rejected or modified add-backs at scale are the norm, not the exception — the gap between management’s adjusted EBITDA and lender-accepted normalized EBITDA routinely reaches 10–15% of the headline figure.
- Add-downs are as important as add-backs. A complete normalization analysis requires identifying costs the business is underincurring — below-market rent, deferred maintenance, underpaid management — and reducing normalized EBITDA accordingly. Failing to apply add-downs overstates earnings and understates the true debt burden.
- Post-closing synergies and unimplemented cost savings have no place in the base EBITDA used for debt sizing. These belong in the lender’s upside scenario only. Given that Moody’s data shows more than 1 in 3 distressed restructurings end in another credit event within two years, the base case must be built on earnings the business has already demonstrated, not earnings it plans to achieve.
- Covenant structures must be anchored to lender-accepted EBITDA, not management’s EBITDA. Private credit’s structural advantage — tighter maintenance covenants enabling earlier lender intervention — is only valuable if the covenant baseline reflects defensible, independently validated earnings. Covenants set against inflated EBITDA create phantom headroom and neutralize the early-warning mechanism that separates direct lending from cov-lite broadly syndicated risk.


