
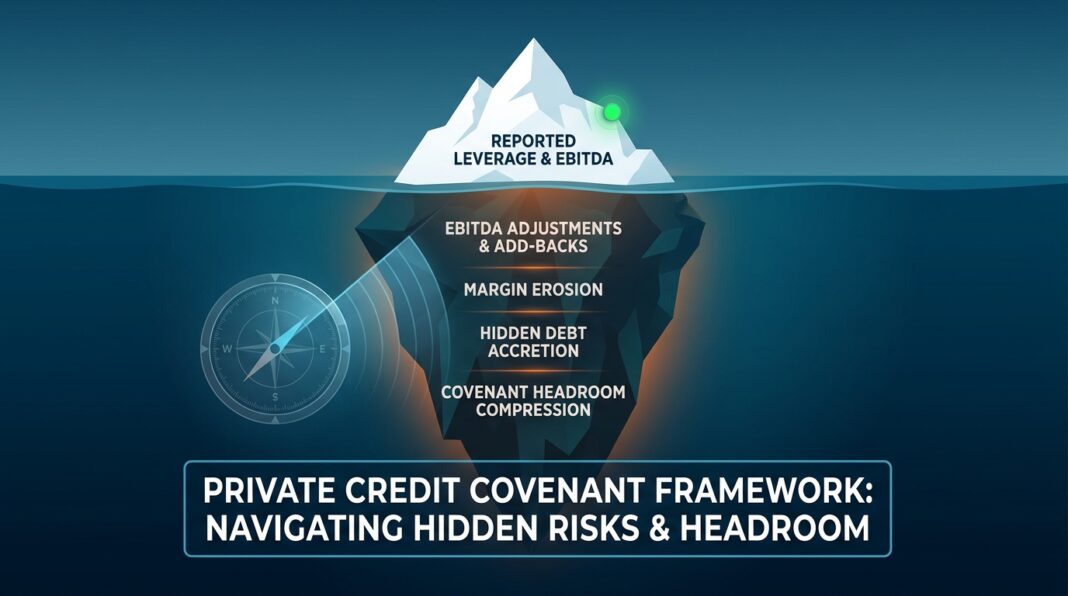
The Underwriting Challenge: When a Covenant Exists But Offers No Protection
A borrower closes a direct lending transaction with $50M in debt against $10M of EBITDA — a 5.0x leverage ratio. The lender includes a maximum leverage covenant of 6.5x. Eighteen months later, EBITDA has quietly eroded to $8.2M through customer churn and margin compression. The leverage ratio has climbed to 6.1x. Yet the covenant has not tripped, no waiver has been negotiated, and no lender conversation has been triggered. The credit is deteriorating in real time while the covenant sits silent.
This scenario is no longer hypothetical. It describes a structural failure endemic to parts of the private credit market today: covenants that are technically present but practically inert. As recent SSRN research documents, covenant-lite structures grew from 4% to 21% of private credit deals between 2023 and 2025, caps on EBITDA add-backs are disappearing, and the Proskauer default index has risen for three consecutive quarters.
The discipline of covenant design is not a documentation exercise. It is one of the most consequential underwriting decisions a lender makes — determining whether you will know about credit deterioration in time to act, or only after the borrower’s liquidity is nearly exhausted.
The Analytical Framework: Three Covenant Types and Their Risk Functions
Effective covenant architecture draws from three distinct categories, each serving a different protective purpose throughout the life of a loan.
1. Financial Maintenance Covenants
According to Sidley Austin, financial maintenance covenants require periodic — typically quarterly — compliance with specified financial metrics. Regular testing reinforces financial discipline and provides lenders with visibility into credit deterioration well before a payment default or insolvency event. The three most common financial tests are:
- Leverage Ratio: Total Debt ÷ EBITDA (maximum threshold, e.g., ≤ 5.5x). Higher values signal distress.
- Interest Coverage Ratio: EBITDA ÷ Interest Expense (minimum threshold, e.g., ≥ 2.0x). Measures debt service capacity.
- Fixed Charge Coverage Ratio (FCCR): (EBITDA – Capex – Taxes) ÷ (Interest + Required Principal). Minimum threshold, e.g., ≥ 1.10x. The most conservative measure of free cash flow adequacy.
As CredCore’s covenant primer explains, financial covenants assess a borrower’s ability to honor its debt through tests expressed as ratios that measure cash flow against obligations. EBITDA is the most commonly used proxy for cash flow, making the precise contractual definition of EBITDA — not just the headline ratio — the critical underwriting variable.
2. Negative (Restrictive) Covenants
Ryan O’Connell, CFA outlines the essential negative covenant suite: debt incurrence restrictions (typically requiring a coverage ratio test, e.g., 2x EBITDA/interest, before new debt can be incurred), negative pledge provisions preventing subordination of bonds, restricted payment limits on dividends and buybacks, asset sale controls requiring debt repayment from proceeds, and change-of-control put rights. Each serves to prevent borrower actions that drain cash or subordinate lender claims without consent.
3. Affirmative (Reporting) Covenants
Carta’s covenant guide describes affirmative covenants as obligations requiring the borrower to provide timely, audited financial statements, maintain adequate business insurance, pay taxes, and remain in good legal standing. These covenants ensure transparency, enabling lenders to proactively monitor a borrower’s health rather than react to disclosures.
Example: Structuring a Covenant Package for a $10M EBITDA Manufacturing Company
Consider a sponsor-backed manufacturing company with LTM EBITDA of $10M and total debt of $55M at close (5.5x leverage). A well-structured covenant package might include:
- Maximum leverage covenant: 6.5x (set with ~18% headroom to closing leverage)
- Minimum interest coverage: 2.0x
- Minimum FCCR: 1.10x (tested quarterly on trailing twelve months)
- Capex basket: limited to $2.5M annually without lender consent
- Restricted payments covenant: no dividends if leverage exceeds 5.0x
- Quarterly financial reporting within 45 days of quarter-end
The leverage covenant set at 6.5x means EBITDA must fall by approximately $8.5M (from $10M to ~$8.5M) before the covenant trips — a 15% buffer. That buffer directly calibrates the lender’s early-warning window.
The Analysis: Calculating Headroom and Diagnosing EBITDA Risk
Headroom Mechanics
Aloan’s covenant calculator framework defines covenant headroom as the distance between a borrower’s current ratio and the contractual threshold. The trajectory matters more than any single quarter: a borrower at 12% headroom that has compressed from 22% over three quarters is a more urgent file than a borrower steady at 9% for a year.
Absolute headroom formula for a leverage covenant:
Headroom (absolute) = Covenant Max − Actual Ratio
Headroom (%) = Headroom (absolute) ÷ Covenant Max × 100
Using CT Acquisitions’ example: a loan closing at 6.0x debt-to-EBITDA with a 6.5x covenant has just half a turn of headroom on day one. If LTM EBITDA falls 8% and total debt is unchanged, the ratio jumps to 6.5x and the covenant trips. This is why LTM EBITDA management — including the cleanliness of add-backs — matters so much for borrower compliance reporting.
The EBITDA Definition Problem
The leverage ratio is only as reliable as the EBITDA definition written into the credit agreement. As Private Equity Bro cautions, EBITDA add-backs — restructuring charges, projected cost savings, and acquisition synergies — can inflate the numerator materially, and it is not unusual to see add-backs that represent 30% or more of reported EBITDA. When adjustments become this large relative to actual earnings, the covenant loses early-warning value: the business can look fine in models while deteriorating in reality.
CT Acquisitions notes that the EBITDA definition inside a credit agreement is often fifteen to thirty pages long, with permitted add-back categories enumerated — including pro-forma adjustments for acquisitions, run-rate cost savings and synergies (often capped at 20–25% of unadjusted EBITDA over an 18–24 month forward look), and restructuring charges. Every underwriter must read and challenge these definitions before commitment.
Stress-Testing Covenant Headroom: A Quick Framework
Apply the following shocks to each compliance quarter in your model:
- Revenue stress: −10% top-line decline, holding margins constant. Calculate EBITDA impact.
- Margin compression: +200bps cost increase (labor, raw materials). Recalculate EBITDA.
- Rate shock: +100bps on floating debt. Recalculate interest coverage and FCCR.
- Add-back haircut: Assume 50% of projected synergy add-backs fail to materialize within 12 months. Recalculate leverage.
As Private Equity Bro recommends, if a 100bps rate shock or a 10% EBITDA downside leaves less than 0.2x coverage headroom, escalate for credit committee review immediately.
Industry Standards and Market Data
Regulatory Benchmarks
The Federal Reserve and OCC’s Interagency Guidance on Leveraged Lending establishes a critical underwriting standard still widely referenced by institutional lenders: a leverage level in excess of 6x Total Debt/EBITDA raises concerns for most industries, and supervisors commonly assume that the ability to fully amortize senior secured debt or repay at least 50% of total debt over a five-to-seven-year period provides evidence of adequate repayment capacity.
Loan covenant caps in today’s market typically sit between 4.0x and 6.0x for senior debt, with total debt including subordinated layers reaching 5.5x to 7.5x for more leveraged structures, according to CT Acquisitions’ 2026 analysis. Investment-grade borrowers typically benchmark at BBB ~2–3x, BB ~3–4x, and single-B ~4–6x+, per Umbrex.
Headroom Calibration Standards
Proskauer’s Private Credit Deep Dives document a clear market shift: while historically the appropriate level of headroom was often 25%, almost all deals today have headroom of 30%+, with 35%+ headroom representing what is generally described as “cov-loose” and 40%+ being common in aggressive large-cap documentation. Separately, Sidley’s March 2026 analysis confirms that a typical leverage covenant in a direct lending transaction may be set with a 25–35% cushion to the EBITDA projected in a sponsor model, and cushions above this level may result in a “cov-loose” structure.
Default Rate Context (2025–2026)
- Leveraged loan default rate (Moody’s, 2025): Projected to end 2025 at 7.5% and peak at 7.9% in Q1 2026 — nearly double the 3.4% historical average. Source: Moody’s U.S. Credit Review, July 2025
- U.S. private credit default rate (Fitch): Climbed to 5.7% by early 2025, up from virtually 0% in 2022. Source: Resonanz Capital citing Fitch, November 2025
- Covenant-lite prevalence: Over 90% of broadly syndicated senior loans now carry no meaningful financial maintenance covenants; fewer than 10% of private credit loans above $500M include them. Source: Resonanz Capital, November 2025
- Leveraged loan recovery rate (Moody’s): Approximately 60%, implying annual losses of ~2.8% at current default rates. Source: Capra Ibex citing Moody’s, December 2024
- Distressed exchanges: Accounted for 56% of all defaults through 2025, with private equity-backed firms driving 80% of defaulted debt in Q2. Source: CoinLaw Default Statistics, 2025
Red Flags Every Lender Must Identify
- EBITDA add-backs exceeding 25% of reported EBITDA: A structural warning that adjusted leverage materially understates true debt burden.
- Uncapped synergy add-backs with no realization timeline: Projected savings that never arrive can inflate compliance reporting for years without detection.
- Covenant set at or near closing leverage: Less than 0.5x headroom on day one provides no early-warning buffer and likely trips only at liquidity crisis.
- PIK interest structures: As Coney (SSRN, 2026) notes, payment-in-kind interest converts cash signals into silence — debt accretes invisibly while EBITDA appears stable.
- Unrestricted subsidiaries holding key assets: Borrowers can designate subsidiaries outside the covenant framework, hollowing out the collateral pool. Sidley (2026) flags this as a key structural risk in competitive sponsor-backed markets.
- Springing covenants with high trigger thresholds: If a revolver covenant only springs when drawn >40% — and the borrower manages usage carefully — the lender may receive no early warning even during severe underperformance.
Underwriting Checklist: Covenant Design and Ongoing Monitoring
At Origination
- ☐ Map the EBITDA definition — read every permitted add-back category. Cap synergy add-backs at ≤20–25% of unadjusted LTM EBITDA and require realization documentation within 18–24 months.
- ☐ Calculate day-one headroom — confirm leverage covenant is set with no less than 25% cushion to the base case model EBITDA. Document in the credit approval memo.
- ☐ Include at least one maintenance covenant — the leverage ratio is the most important. For businesses with material fixed obligations, add a minimum FCCR (≥1.10x) and interest coverage (≥2.0x).
- ☐ Restrict unrestricted subsidiaries — require lender consent for any subsidiary designation that removes operating cash flow from the covenant perimeter.
- ☐ Limit equity cure rights — cap to no more than twice over the loan life; prohibit EBITDA cures that inflate adjusted earnings without real cash improvement.
- ☐ Test under stress scenarios — run a −10% EBITDA shock and +100bps rate shock before commitment. If headroom disappears under either, re-price or restructure.
- ☐ Negotiate reporting covenants — require quarterly financials within 45 days and annual audited statements within 90 days of fiscal year-end. Include compliance certificates signed by a financial officer.
During Portfolio Monitoring
- ☐ Track covenant headroom as a percentage, not just absolute ratio, each quarter. Flag any credit with headroom <15% for proactive lender-borrower dialogue.
- ☐ Monitor headroom trajectory — three consecutive quarters of compression, regardless of absolute level, warrants credit committee escalation. As S&P Global Market Intelligence advises, advanced covenant monitoring plays a pivotal role in early detection, enabling proactive management to avoid costly defaults.
- ☐ Review all add-back realizations quarterly — track actual synergy capture against projections. Remove unrealized add-backs from compliance calculations if past their contractual window.
- ☐ Validate EBITDA independence — do not rely solely on borrower-prepared compliance certificates. Spread financials from source documents and reconcile to the contractual EBITDA definition independently.
- ☐ Conduct annual bring-down diligence — as the ADB Bond Market Forum notes, bring-down due diligence is a best-practice iterative check on whether material changes have occurred since original underwriting, including collateral valuations, management changes, and industry developments.
Key Takeaways
- 🔑 Covenant design is an underwriting decision, not a documentation formality. The interplay between EBITDA definitions, headroom calibration, and add-back permissions determines whether a covenant actually functions as an early-warning mechanism or merely creates a false sense of protection.
- 🔑 EBITDA add-backs are the single largest source of covenant dilution. When adjustments exceed 25–30% of reported EBITDA, the leverage ratio used for compliance no longer accurately reflects operating performance. Always underwrite to unadjusted or lightly adjusted EBITDA in your base case.
- 🔑 Headroom trajectory is more informative than a single quarter’s reading. A borrower consistently compressing from 30% headroom to 15% over six quarters is a critical watch-list credit — even if no covenant has yet tripped.
- 🔑 Rising default rates demand more — not fewer — covenant protections. With Moody’s projecting leveraged loan default rates near 7.5–7.9% through early 2026 and private credit defaults approaching 5.7%, the economic cost of weak covenant structures is now directly measurable in portfolio losses.
- 🔑 Active monitoring infrastructure is a prerequisite for meaningful protection. Covenants are only as effective as a firm’s ability to track, interpret, and act on them in real time. Lenders that rely on manual, periodic reviews are structurally disadvantaged against borrowers with sophisticated financial teams optimizing their compliance positions quarter-by-quarter.


