
Market headline
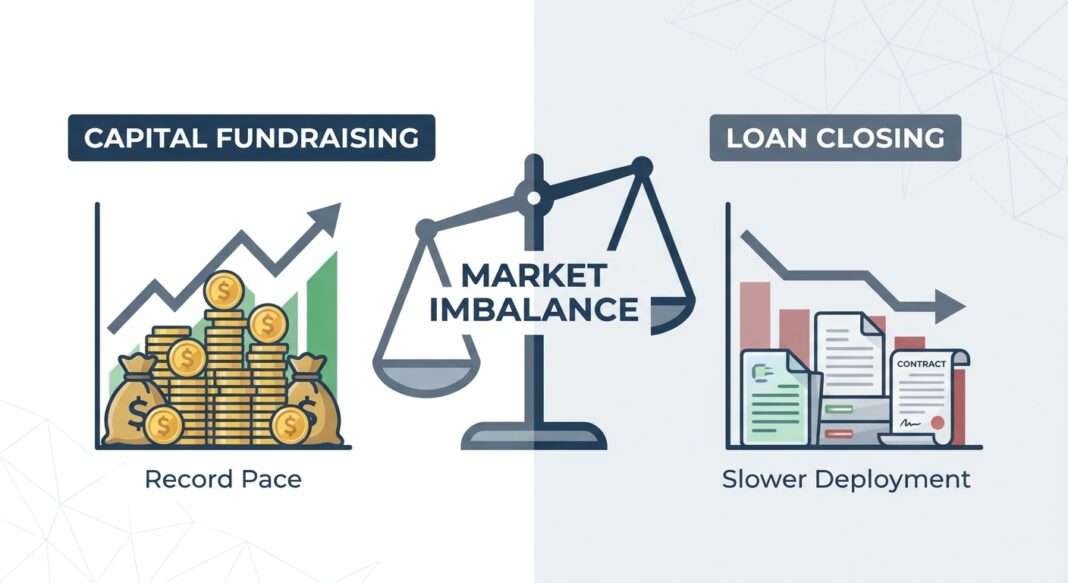
Private credit’s immediate tension is no longer simply whether capital is available. Fundraising is running far ahead of deployment, while direct-lending issuance, particularly sponsor-backed and software activity, remains weak. Preqin reported on November 8 that private credit funds had raised $185 billion through Q3 2026, equal to 95% of the full-year 2025 total, despite substantially fewer fund closes. Meanwhile, KBRA’s October 16 review put Q3 U.S. direct-lending volume at $38.9 billion, the lowest quarterly total since Q2 2023, and the year-to-date total was 31% below the comparable 2025 period.
That mismatch is changing the negotiating balance, but not uniformly. Core middle-market spreads have widened from early-year lows and leverage has moderated. Top-quality borrowers still find competitive terms, while businesses with weaker earnings visibility face higher margins, greater equity requirements, and tighter covenant expectations. Public credit is also repricing: high-yield spreads widened sharply in October before retracing some of that move by November 12. The data point to selective underwriting and uneven liquidity, not a market-wide lending shutdown.
Quantitative snapshot
The figures below use the latest monthly or quarterly releases available by November 15. Private-loan spread measures and public-market OAS are not perfectly comparable: loan structures, ratings, fees, floors, and liquidity differ.
| Metric | Latest reading | Prior comparison | Source |
|---|---|---|---|
| Core middle-market LBO spread | S+510 bps, September 2026 | 10 bps wider than August; S+500 | KBRA DLD, October 16 |
| Large-cap private-loan spread | S+516 bps, September 2026 | Premium over single-B debt was 177 bps, 12 bps above the rolling two-year average | KBRA DLD, October 16 |
| U.S. high-yield OAS | 320 bps, November 12, 2026 | 24 bps tighter than 344 bps on October 30 | FRED, ICE BofA series |
| U.S. direct-lending volume | $38.9 billion, Q3 2026 | Lowest quarter since Q2 2023; year-to-date volume down 31% year over year | KBRA DLD, October 16 |
| Private-credit fundraising | $185 billion through Q3 2026 | Already 95% of the full-year 2025 total, with fewer fund closes | Preqin, November 8 |
| Senior-secured and unitranche default rate | 2.41%, Q3 2026 | Down from 2.51% in Q2 2026 | Proskauer, October 27 |
For a public yield reference, the Morningstar LSTA loan index showed an 8.64% yield to worst and a 450-bp discount margin at October 31, while U.S. high-yield bonds yielded 8.30% with a 344-bp OAS. First Trust’s October 2026 market data cautions that the instruments and risk profiles differ. The spread comparison nonetheless shows why borrowers compare syndicated execution with private certainty, rather than treating either channel’s headline price as a like-for-like quote. First Trust, November 11
Sector analysis
Commercial services is attracting a larger share of direct-lending activity. KBRA reported that the sector represented 31% of U.S. direct-lending deals through Q3, up from 23% in 2025. Industrial manufacturing also gained share, reaching 9% from 7%. The shift is consistent with lenders prioritizing businesses whose demand and cash flows are less exposed to rapid technology substitution, though sector labels do not replace company-level diligence.
Technology is moving the other way. Its share of direct-lending deals was 15% through Q3, down from 19% in 2025, and it accounted for 12% of Q3 deal count. Software volume weakened especially among issuers with at least $50 million of EBITDA, and KBRA reported a 50-bp spread gap between software and non-software technology. In PitchBook LCD’s Q3 leveraged-finance survey, published October 1, 54% of respondents named software the least favorable credit-investment sector through Q1 2027. That is a lender-attitude measure, not a default forecast.
Leverage and pricing also vary by deal size. KBRA reported September total leverage of 4.6x for upper-middle-market and large-cap LBOs, down from 4.8x in August; core middle-market leverage was 4.3x, below the 4.7x to 4.8x average over the prior five months. Lower-middle-market LBO leverage was 3.8x. Spreads widened in each segment during September: core middle market reached S+510 and lower middle market S+528, the latter a two-year high. These levels suggest less room for optimistic EBITDA add-backs and debt-funded equity extraction.
Bank credit is not replacing private lenders across the board. The Federal Reserve’s October SLOOS, released November 2, said standards for C&I lending to large and middle-market firms were broadly unchanged in Q3, but standards tightened for small firms and banks raised risk premiums across borrower sizes. Banks also reported tighter standards and weaker demand across CRE loan categories. Meanwhile, PitchBook LCD’s October private-credit monitor says the syndicated market won more large buyout and refinancing activity, while direct-lending spreads widened as syndicated spreads tightened. Channel competition is strongest for larger, higher-quality credits.
Implications
What this means for borrowers
Borrowers should expect financing terms to depend increasingly on cash-flow durability, size, sector exposure, and lender channel. A strong business may still obtain sub-S+500 pricing, while the Q3 LCD survey found more respondents expecting a $50 million EBITDA non-cyclical borrower to price above S+550 than in the prior quarter. That dispersion argues for running parallel financing cases and comparing total cost, OID, call protection, amortization, covenants, and certainty of close. In operating forecasts, model interest expense under higher floating rates and test fixed-charge coverage after maintenance capex, taxes, and working-capital needs. Do not size debt solely to adjusted EBITDA.
What this means for lenders and investors
Fundraising strength is not proof of deployable deal flow. Preqin also reported that 79% of surveyed LPs planned to commit to just one private-credit fund over the next 12 months, concentrating capital allocation. Investors should distinguish commitments from funded loans and track amendments, PIK interest, non-accruals, and recovery outcomes alongside headline defaults. Proskauer’s Q3 default rate fell, but that index covers senior-secured and unitranche loans and should not be conflated with broader default measures.
Over the next three to six months, liquidity is likely to remain available for defensible credits, but lower transaction volume and lender scrutiny should keep weaker borrowers’ refinancing paths narrow. The Federal Reserve’s latest survey adds a regulatory and bank-credit signal: riskier C&I loans face higher pricing, while small-business and CRE availability remains constrained. For operators, preserving cash, documenting recurring earnings, and maintaining covenant headroom can matter as much as negotiating headline spread. For investors, underwriting should test downside cash interest coverage and refinancing capacity, not just sponsor support.
Key market insights
- Private-credit fundraising is strong, but Q3 deployment fell to a multiyear low.
- Core and lower-middle-market LBO spreads are above early-2026 levels, with leverage lower in September.
- Commercial services and industrial manufacturing gained direct-lending share; software lost share.
- Large and middle-market bank C&I standards were stable overall, but banks tightened risk pricing and small-firm terms.
- Borrowers should stress-test FCCR against floating-rate costs and seek terms across private and syndicated channels.


