
Underwriting & Risk Management | Credit Analysis
EBITDA Adjustments and Normalization: The Credit Underwriter’s Guide to Separating Sustainable Earnings from Financial Engineering
The Underwriting Challenge: Which EBITDA Are You Actually Lending Against?
A mid-market manufacturing company presents a Confidential Information Memorandum showing $10.2 million in adjusted EBITDA on $48 million of revenue. The sponsor is seeking $51 million in senior secured debt — a 5.0x leverage multiple that appears, on its face, within acceptable institutional parameters. But buried in the add-back schedule are $2.1 million of adjustments: $800K for a “one-time” ERP implementation, $600K for executive severance the borrower characterizes as non-recurring, $400K in projected cost synergies from a bolt-on acquisition not yet closed, and $300K for owner perks run through the P&L.
Strip those adjustments down to what is truly defensible, and EBITDA falls to $8.4 million — pushing leverage to 6.1x and materially changing the credit risk profile of the transaction. That $1.8 million gap is not just a valuation disagreement; it is a structural underwriting error.
In the current private credit environment, this challenge has grown more acute. The gap between reported and adjusted EBITDA has become a primary source of underwriting risk, not merely a negotiation point. Lenders who treat seller-provided EBITDA schedules as a conclusion rather than a starting point are accepting credit risk they have not properly measured — and the default data now confirms it.
The Analytical Framework: Building a Lender-Underwritten EBITDA Bridge
The discipline of EBITDA normalization requires a lender to independently reconstruct a borrower’s earnings from the ground up. This process — often formalized through a Quality of Earnings (QoE) analysis — is distinct from accepting management’s adjusted EBITDA presentation. As practiced by institutional lenders, it involves four distinct analytical layers:
Layer 1: Reported-to-Adjusted EBITDA Bridge
Begin with audited or reviewed financial statements — ideally three to five years of historicals plus trailing-twelve-month (TTM) data. The bridge moves from GAAP net income upward: add back interest expense, taxes, depreciation, and amortization to arrive at reported EBITDA. This is the only number that carries the credibility of an audit. Every adjustment beyond this point requires independent verification.
Layer 2: Normalization Adjustments (Lender-Accepted)
Institutional lenders apply a disciplined filter to each proposed add-back. The most commonly accepted categories include non-cash charges (depreciation on acquired intangibles, stock-based compensation with genuine equity dilution), truly one-time legal settlements where the matter is fully resolved, excess owner compensation above documented market replacement cost, and related-party rent normalized to arms-length market rates.
The standard is not perfection — it is traceability and reasonableness: Can the adjustment be traced to financial records? Is the rationale clear and documented? Would the cost truly be eliminated or restructured under ongoing operations?
Layer 3: Normalized EBITDA vs. Adjusted EBITDA
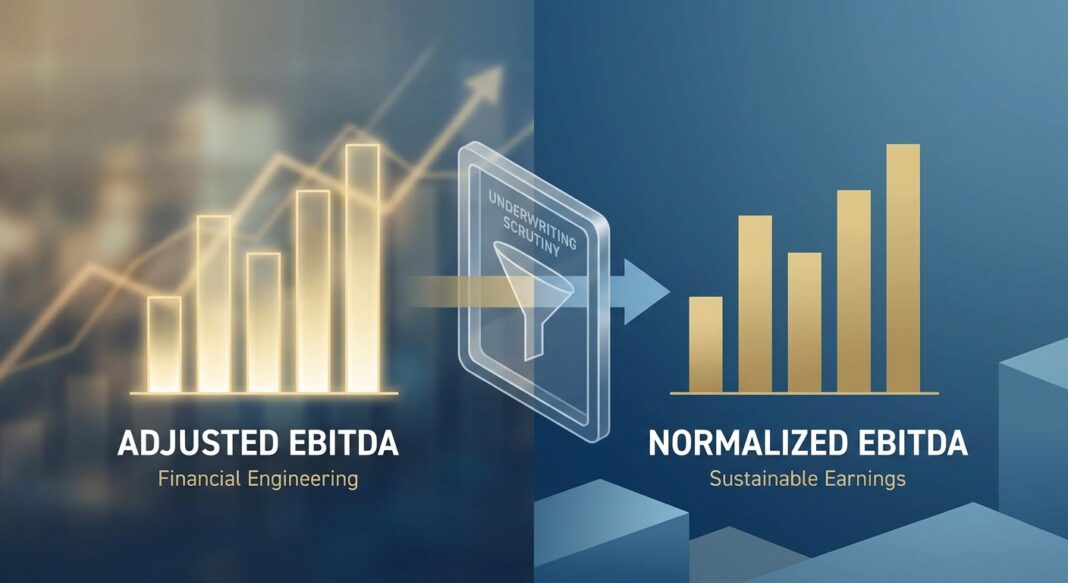
These two terms are not interchangeable. Adjusted EBITDA may include run-rate synergies, anticipated cost savings, or buyer-specific improvements. Normalized EBITDA reflects only the earnings a lender can sustainably underwrite based on demonstrated, in-period performance. Normalized EBITDA can actually be lower than adjusted EBITDA when the business requires incremental costs post-close — replacement management hires, ramping sales infrastructure, or capital investment to sustain current revenue.
Layer 4: Cash Conversion Verification
The final and most critical layer: reconcile normalized EBITDA to actual free cash flow. Add-backs increase the EBITDA denominator in leverage calculations, but they do not generate cash. Interest payments, amortization, and working capital requirements demand real liquidity — and aggressive normalization can produce a leverage ratio that looks acceptable on paper while masking a cash-strapped borrower.
Core Metrics: The Underwriter’s Calculation Stack
- Total Leverage: Total Debt ÷ Normalized EBITDA
- Net Leverage: (Total Debt − Cash) ÷ Normalized EBITDA
- Debt Service Coverage Ratio (DSCR): Normalized EBITDA ÷ (Cash Interest + Scheduled Amortization)
- Cash Interest Coverage: Normalized EBITDA ÷ Cash Interest Expense
- QoE Ratio: Cash Flow from Operations ÷ Net Income (a ratio >1.0 signals earnings backed by real cash)
Walking the Numbers: A $10M EBITDA Manufacturing Credit
Return to the manufacturing borrower from our opening. Here is how a disciplined lender deconstructs the EBITDA bridge:
| Line Item | Borrower’s Claim | Lender’s Verdict | Accepted Amount |
|---|---|---|---|
| Reported EBITDA (GAAP) | $8,100,000 | Audited — Accepted | $8,100,000 |
| ERP Implementation (“one-time”) | +$800,000 | Recurring tech spend cycle; rejected | $0 |
| Executive Severance | +$600,000 | Two events in 3 years; partial credit | +$300,000 |
| Acquisition Synergies (not yet closed) | +$400,000 | Post-closing assumption; rejected | $0 |
| Owner Perks / Personal Expenses | +$300,000 | Market replacement cost verified | +$300,000 |
| Lender-Underwritten Normalized EBITDA | $10,200,000 | — | $8,700,000 |
At $51M of proposed debt against $8.7M of lender-underwritten EBITDA, actual leverage is 5.86x — not the 5.0x the sponsor presented. The DSCR, assuming a 7.5% all-in rate on senior debt and 5% amortization, falls to approximately 1.15x — uncomfortably close to the typical 1.10x covenant trigger and well below the 1.25x institutional threshold most direct lenders require as minimum headroom.
Stress-testing the base case: Apply a modest 10% EBITDA compression — a scenario consistent with a mild demand slowdown — and normalized EBITDA drops to $7.83M. Leverage rises to 6.5x and DSCR falls below 1.0x, placing the borrower in technical distress under even a conservative macro scenario. This is not an edge case. According to S&P Global’s analysis of the U.S. middle market credit population, a 10% EBITDA decline combined with a 50-basis-point rate increase pushes over 25% of firms below 1.0x interest coverage.
What Institutional Lenders Require: Standards, Data, and Red Flags
The private credit market has learned the cost of EBITDA inflation the hard way. The default data from 2025 and 2026 reflects years of aggressive normalization practices compounding into credit deterioration at scale.
📊 Credit Performance Data Box
- Private Credit Default Rate (2025): Moody’s estimates the private credit direct lending default rate ranged from 1.6% to 4.7% in 2025, depending on whether distressed exchanges are included. [Moody’s, April 2026]
- Distressed Restructurings: Distressed exchanges accounted for approximately 65% of all 2025 private credit defaults — debt modifications and maturity extensions agreed under duress, not genuine payoffs. [Forbes / Moody’s, May 2026]
- Record Default Rate: In May 2026, Fitch Ratings reported the U.S. private credit default rate reached a record high of 6.0% in April 2026, with private-credit-backed corporate borrowers experiencing a 9.2% default rate across full-year 2025. [Fitch via Forbes, May 2026]
- Proskauer Default Index (Q1 2026): Proskauer’s Private Credit Default Index, tracking 697 loans totaling $189.2 billion, recorded a 2.73% default rate in Q1 2026 — up from 1.84% just two quarters prior. [Forbes, May 2026]
- Middle Market Leverage: S&P Global Ratings found that average leverage across the U.S. middle market credit estimate population hit 7.0x in 2024, with 20% of companies already below 1.0x EBITDA interest coverage. [S&P Global via ABF Journal, 2025]
The Most Common Red Flags in EBITDA Normalization
- Recurring costs labeled “one-time.” ERP upgrades, restructuring charges, and litigation costs appear in multiple periods across the historical financials. If a cost recurs every 18–24 months, it is an operating cost, not an add-back.
- Forward-looking synergy add-backs. Synergies from acquisitions not yet closed, cost savings dependent on post-closing headcount reductions, or anticipated price increases not yet in the run rate are the highest-risk adjustments. These do not belong in lender-underwritten normalized EBITDA.
- Deteriorating QoE ratio. When a borrower’s cash flow from operations consistently runs below net income — a QoE ratio below 1.0 — it signals that reported profitability is outpacing cash generation. This is a structural warning sign, not a timing difference.
- Widening EBITDA-to-cash-flow gap. Aggressive add-backs can reduce the stated leverage ratio without improving the borrower’s actual liquidity position. As one practitioner-level analysis notes, a borrower can inflate adjusted EBITDA on paper — but they cannot print cash to service debt.
- Covenant headroom built on inflated EBITDA. Loans structured with 25–30% headroom on a manipulated EBITDA base offer far less protection than they appear. When normalized earnings prove to be $1–2M lower than the deal EBITDA, covenant breaches occur at the first point of stress.
Institutional Lending Standards (2025–2026)
Leading direct lenders in the middle market are currently holding the line at 5.0x–5.5x senior leverage on first-lien credits with strong cash conversion and clean financial reporting. Transactions requiring 6.5x leverage or more to meet return targets are increasingly difficult to finance in the current environment, as lenders demand downside scenario analysis and demonstrated cash flow visibility. Financial covenant structures in private credit now routinely carry 30%+ EBITDA headroom — with “cov-loose” deals requiring 35% or more — precisely because normalized EBITDA at deal close has frequently proved optimistic within the first 12–18 months post-funding.
The EBITDA Normalization Underwriting Checklist
Use this framework on every new credit that includes a management-provided adjusted EBITDA schedule:
✅ Documentation Requirements
- ☐ Three to five years of audited or CPA-reviewed financial statements, plus TTM monthly trial balances
- ☐ Three years of federal and state income tax returns (cross-check reported income to filed returns)
- ☐ Bank statements for the trailing 24 months (verify cash deposits against reported revenue)
- ☐ Detailed add-back schedule with invoice-level or ledger-level support for each adjustment
- ☐ Third-party QoE report commissioned by the lender or confirmed to lender’s standards
✅ Analytical Steps
- ☐ Build the GAAP-to-reported EBITDA bridge independently from management’s schedule
- ☐ Apply a recurrence test to every proposed add-back: Does this cost appear in more than one period across the historical statements?
- ☐ Apply a cash test: Does accepting this add-back improve the reported EBITDA but not the actual cash flow statement?
- ☐ Verify owner/executive compensation against market comp data (third-party salary surveys)
- ☐ Reject any synergy or cost-saving add-back not yet reflected in completed periods of the P&L
- ☐ Compute the QoE ratio (Cash from Operations ÷ Net Income) — flag any ratio below 0.85 for deeper review
✅ Stress Testing
- ☐ Run base, adverse (−10% EBITDA), and severe (−20% EBITDA) scenarios against normalized EBITDA
- ☐ Confirm DSCR remains above 1.10x in the adverse case with no covenant amendment
- ☐ Test the impact of a 50bps rate increase on floating-rate DSCR, particularly for PIK-adjacent structures
- ☐ Model working capital requirements through at least two full seasonal cycles
✅ Questions to Ask Management
- ☐ “Which of these add-backs have you received full credit for in prior debt facilities?”
- ☐ “What is the replacement cost of the owner’s operating role, documented by a third party?”
- ☐ “Are any cost savings in this bridge dependent on headcount reductions not yet executed?”
- ☐ “What is the history of the ERP / technology spend? Is this a one-time upgrade or a periodic cycle?”
Key Takeaways for Credit Underwriters
- Seller-provided EBITDA is a starting point, not a conclusion. Lenders must independently reconstruct earnings from audited financials and verified supporting schedules — every adjustment demands documentation and a cash conversion test.
- Normalized EBITDA and adjusted EBITDA are not the same number. Adjusted EBITDA can include forward-looking assumptions and buyer synergies. Lender-underwritten normalized EBITDA reflects only the earnings a borrower has already demonstrated, under sustainable operating conditions.
- Add-backs improve leverage ratios but not liquidity. A borrower can inflate covenant EBITDA without generating a single additional dollar of cash to service debt. Lenders must maintain independent liquidity tests alongside EBITDA-based covenants.
- The default data is unambiguous. With private credit default rates reaching record levels in 2025–2026 — and distressed exchanges comprising the majority of those events — the underwriting errors of the 2020–2022 vintage are now materializing as realized losses. Overlevered deals built on inflated EBITDA are the common thread.
- Covenant headroom is only as reliable as the EBITDA it is built on. A 30% covenant cushion calculated against a $10M management EBITDA provides very different protection than the same cushion calculated against $8.7M of lender-underwritten earnings. Build the covenant on the number you own.


