
Market Headline: A Lender-Friendly Reset Takes Hold
The private credit market has entered a decisive inflection point in mid-2026. Following a turbulent first quarter — defined by a U.S.-Iran military conflict that disrupted energy pricing, an AI-driven repricing of software-sector credit, and a wave of retail redemption requests that exposed structural vulnerabilities in non-traded business development companies (BDCs) — the market has stabilized but is not returning to 2025 norms.
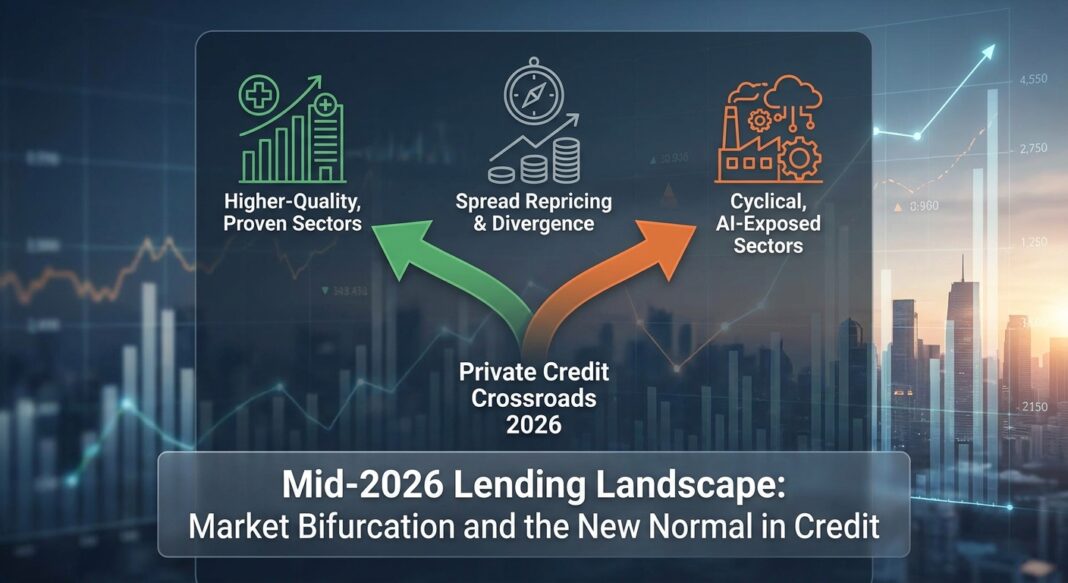
Valuation Research Corporation confirmed that direct lending markets stabilized through Q2 2026 following Q1 volatility, with lending activity remaining competitive specifically for higher-quality credits. Yet the macro backdrop is unambiguous: credit markets have entered a renewed phase of price discovery, shaped by three converging forces — geopolitical risk premium, AI-driven sector disruption, and a structural reassessment of retail-channel liquidity in private credit vehicles. The net result is a two-speed market: capital flows freely and at tight spreads to highest-quality, proven sponsors, while cyclical, AI-exposed, and energy-intensive borrowers face materially wider pricing and tighter covenants.
For operators and institutional investors, this bifurcation is the defining dynamic of H2 2026. The path through it demands precision: knowing which sectors carry lender favor, what KPI thresholds lenders are enforcing, and where the best risk-adjusted opportunities now reside.
Quantitative Market Snapshot
The following data table reflects current market conditions as of August 12, 2026. All figures are sourced from publicly available institutional research and regulatory filings.
| Metric | Current Value (Q2/Aug 2026) | Prior Period Comparison | Source |
|---|---|---|---|
| Overnight SOFR Rate | 3.63% | 3.68% (3-month Term SOFR, Q2 2026) vs. 3.92% (5-yr UST Mar 2026) | NY Fed / SOFRRate.com, Aug 10, 2026 |
| Fed Funds Target Rate | 3.50%–3.75% | Held steady Q1–Q2 2026; higher-for-longer forward curve broadly flat | Federal Reserve / SOFRRate.com, Aug 6, 2026 |
| Middle Market Private Credit Spreads | ~SOFR + 500 bps (broadly) | +25 bps increase in Mar 2026; expected yields up ~50 bps in Q2 | VRC Q2 2026 Private Markets Update |
| HY OAS (ICE BofA US HY Index) | ~273 bps (Aug 2026) | B-rated loan secondary spreads ~67 bps wider than year-end 2025 | ICE BofA / Fed Data via Trading Economics |
| Software Sector Secondary Spread Premium | ~245 bps wider than year-end / ~229 bps above B-rated loan index | Widened sharply Q1 2026 amid AI disruption concerns | PitchBook LCD via VRC, Jun 19, 2026 |
| Private Credit AUM & Dry Powder | $2.02T AUM; ~$264B dry powder | Forecast to exceed $2T in 2026; growing toward $4T by decade end | Moody’s, Apr 2026 / VRC Q2 2026 |
| Private Credit H1 2026 Fundraising | $262 billion raised H1 2026 (+30% YoY) | Q2 alone: $173B (70% of H1 total); Q1 was weak | The Credit Crunch, Jun 30, 2026 |
| Middle Market Borrower Interest Coverage (ICR) | ~1.6x (2025 vintage) | Down from 3.1x in 2021; modest YoY improvement noted in Q2 2026 | Angel Investors Network / Cliffwater data, Jun 2026 |
| Estimated Private Credit Default Rate (2025) | ~1.6%–4.7% (inclusive of restructurings) | Headline rate below 2%; "true" rate approaches 5% with LMEs | Moody’s, Apr 2026 |
| BDC PIK Income Share | ~8% of investment income (public BDC average) | Rising trend flagged by FSB, IMF as structural risk vector | Within Intelligence / FSB May 2026 |
Note: All-in yields for middle market direct lending approximate SOFR + 500 bps, equating to roughly 8.6%–9.1% on a fully loaded basis as of August 2026. The 5-year U.S. Treasury yield stood at approximately 4.23% in June 2026, up from 3.92% in March, per VRC.
Sector Analysis: Divergence Is the New Normal
The most consequential structural shift in mid-2026 credit markets is sector-level dispersion. Lender appetite is no longer uniform across industries — it is increasingly dictated by AI exposure, energy cost sensitivity, and cash flow predictability.
🟢 Healthcare & Life Sciences — Still the Preferred Destination
Healthcare led all sectors in private credit direct lending deals in 2025, accounting for 19% of total deal count, with spreads holding at approximately SOFR + 500 bps in Q4 — the only major sector to avoid significant year-over-year spread tightening. Lender appetite is sustained by demographic tailwinds, non-cyclical service models, and consolidation-driven deal flow across physician practices, dental, dermatology, veterinary, and health-tech platforms. According to bfinance, specialist healthcare private credit funds have posted median net IRRs of 15%, compared to 11% for generalist U.S. direct lending. However, Morgan Stanley’s 2026 outlook flags an important nuance: healthcare has also led all sectors in loans placed on non-accrual status — a reminder that subsector selectivity within healthcare is essential.
🟡 Technology & AI Infrastructure — A Bifurcated Story
Technology remains a high-allocation sector for private credit, but the composition has radically shifted. Technology-sector direct lending anchored by software companies with recurring SaaS revenue models and gross margins exceeding 70% has attracted dedicated capital pools from Blue Owl’s technology credit platform and Golub Capital, with loan structures increasingly referencing ARR multiples rather than EBITDA. Conversely, software sector secondary spreads are approximately 245 bps wider than year-end levels and roughly 229 bps above the broader B-rated loan index — a direct consequence of AI-driven disruption risk repricing legacy software credits. On the infrastructure side, Morgan Stanley estimates private credit could supply more than half the $1.5 trillion needed for global data center buildouts through 2028, reflecting an enormous structural origination opportunity for lenders willing to underwrite AI-related infrastructure.
🔴 Energy-Intensive Industrials & Manufacturing — Tighter Standards
Lenders have tightened underwriting standards for energy-intensive industries and businesses whose leverage was predicated on stable energy costs, following volatility in oil markets triggered by the U.S.-Iran military conflict in late February 2026. These sectors face higher risk premiums, shorter permitted maturities, and stricter collateralization — conditions that are expected to persist through Q3/Q4 2026 as markets reassess the oil price outlook.
🟢 Lower & Core Middle Market — Structural Differentiation Advantage
As of Q1 2026, just 39% of upper middle market issuers were unique to a single private credit portfolio, compared to 80% of lower middle market issuers (Cliffwater data). This disparity underscores the differentiated opportunity in the lower and core middle market, where deal flow is less crowded by mega-lender capital concentration, and lenders retain stronger pricing power and covenant control. Capital in this segment, below $40M EBITDA, remains a genuine alpha generator relative to the commoditized upper middle market.
Implications for Operators & Institutional Investors
For Borrowers & Operators
The operative reality for middle market operators in H2 2026 is a lender-friendly reset. More deal flow and wider spreads are constructive for lenders, but the most durable advantage may come from better documentation, more conservative leverage, and the time to conduct stress analysis before capital is deployed. Borrowers should anticipate:
- Higher all-in costs: SOFR at 3.63% plus spreads of 400–550 bps puts all-in yields in the 8%–9.1% range — a meaningful drag on FCCR for companies with leverage above 4.5x EBITDA.
- Tighter covenants: The Fed’s April 2026 SLOOS confirmed that banks reported higher premiums on riskier loans, stricter loan covenants, shorter maximum maturities, stricter collateralization requirements, and lower maximum credit line sizes for non-depository financial institutions — signals that are migrating into private credit documentation.
- ICR scrutiny: With the middle market aggregate interest coverage ratio having compressed from 3.1x in 2021 to 1.6x in 2025, operators must prioritize EBITDA growth and debt paydown to maintain lender confidence. Lenders are requiring minimum FCCR floors in the 1.10x–1.25x range on new credits, with tighter tests for cyclical sectors.
- AI risk assessment is now standard: An AI strategy and an evaluation of AI’s potential risk on a business have emerged as a critical analytical component both in underwriting new transactions and evaluating existing portfolio credits.
For Institutional Investors & Lenders
Non-accruals, PIK usage, sector concentration, and 2021–2022 vintage exposure are the key portfolio differentiation indicators for the remainder of 2026. The Q2 2026 SLOOS data showed that bank C&I lending standards are unchanged at levels described as easier than the midpoint of banks’ historic ranges — signaling that bank competition remains real in the upper middle market. Well-capitalized private lenders with institutional-grade LP backing, rather than retail distribution, are structurally advantaged: elevated redemptions in retail-oriented vehicles have led some large private credit lenders to moderate investment activity, contributing to more attractive supply and demand dynamics for well-capitalized lenders backed by institutional capital.
Forward-Looking View: Liquidity & Lending Dynamics, H2 2026 and Into 2027
The market’s trajectory through year-end and into early 2027 hinges on four key variables:
- The Fed’s rate path. Market expectations continue to reflect a higher-for-longer environment, with the forward curve broadly flat as of June 2026. Unless the Fed pivots materially, all-in private credit yields will remain elevated, sustaining income for lenders while pressuring borrower FCCRs.
- M&A cycle normalization. Private equity deal value increased approximately 10.7% year-over-year with exit activity rising 14% — early signs of normalization. A sustained M&A recovery would accelerate new-money credit deployment and begin to absorb the estimated $264 billion in private credit dry powder.
- Refinancing wall management. As of June 30, 2026, just 15% of BDC debt investments were due in 2026–2027, down from 27% in mid-2024, indicating meaningful progress on the maturity wall. This reduces near-term systemic refinancing risk.
- Credit secondaries as the liquidity release valve. Credit secondaries volume has set new highs every year since 2020, with fundraising up 6x year-on-year in H1 2026, led by Ares’ $7 billion raise. This structural growth provides institutional investors with exit optionality that didn’t exist at scale previously. Over time, new deal demand together with a large refinancing wave is expected to gradually overtake private credit supply, creating an imbalance that allows lenders to preserve discipline, strengthen terms, and capture the illiquidity premium to public markets.
Key Market Insights
- 📌 Spreads are repricing upward, not compressing: Middle market private credit spreads have settled back near SOFR + 500 bps after hitting multi-year lows in 2025, with expected yields up ~50 bps in Q2 2026 alone. Lenders are being paid to be selective.
- 📌 The great bifurcation is structural, not cyclical: The gap between upper and lower middle market deal concentration, between software-exposed and non-AI-disrupted credits, and between institutional-grade and retail-channel lenders is widening. Portfolio positioning by segment is now a primary performance driver.
- 📌 ICR compression is the #1 operator risk: With middle market borrower interest coverage ratios near 1.6x — down from 3.1x in 2021 — operators with high leverage and limited EBITDA growth face imminent covenant pressure. FCCR management, not just topline growth, is the critical financial discipline.
- 📌 Bank standards are easing at the margin, creating competitive tension in large-cap direct lending: The July 2026 SLOOS confirms C&I standards at easier-than-historical-midpoint levels for large and middle-market firms. Private credit lenders in the upper market face renewed bank competition; alpha is concentrated in the lower and core middle market.
- 📌 Credit secondaries are redefining liquidity for private credit investors: With $262 billion raised in H1 2026 (up 30% YoY) and secondaries volumes at all-time highs, institutional LPs now have a viable exit mechanism that changes portfolio construction math. Managers with strong secondary market access have a distinct fundraising and retention advantage heading into 2027.


