
The Underwriting Problem Hidden in Plain Sight
Every credit decision in the middle market begins with the same deceptively simple question: How much cash does this business actually generate? The answer almost never lives in the reported financials. Between owner-specific perquisites, transaction costs, one-time restructuring charges, and creatively reclassified operating expenses, reported EBITDA and the earnings a lender can realistically underwrite are routinely separated by a material gap.
That gap is where credit losses are born.
The mechanics are well-documented. Every dollar of inflated or unjustified EBITDA has a disproportionate impact on valuation and deal returns — a rejected $100K add-back at a 6.0x multiple erases $600K in enterprise value and directly reduces debt capacity. When lenders fail to independently stress-test the earnings bridge, they size debt against a fiction. The collateral consequence: tighter interest coverage ratios, covenant stress earlier in the loan’s life, and elevated workout risk.
This article teaches the complete analytical framework for EBITDA normalization — how institutional lenders classify add-backs, stress-test sustainable earnings, size debt responsibly, and identify the red flags that reveal aggressive normalization before commitment.
The Analytical Framework: From Reported to Underwriteable EBITDA
Sophisticated lenders distinguish between two concepts that sellers and borrowers frequently conflate:
- Adjusted EBITDA: The bridge from reported financials to a cleaned-up earnings number after removing one-time and non-operating items.
- Normalized EBITDA: Goes further to reflect the earnings a lender can sustainably underwrite after considering steady-state staffing, market-rate compensation, and necessary ongoing reinvestment. Normalized EBITDA can be lower than adjusted EBITDA when the business requires additional costs under new ownership.
This distinction matters enormously at the credit committee table. According to Pepperdine University’s 2025 Private Capital Markets Report, roughly 76% of lower middle-market valuations use the recast (adjusted) figure — meaning a single disputed line item compounds directly into purchase price and, by extension, into the lender’s loan-to-value exposure.
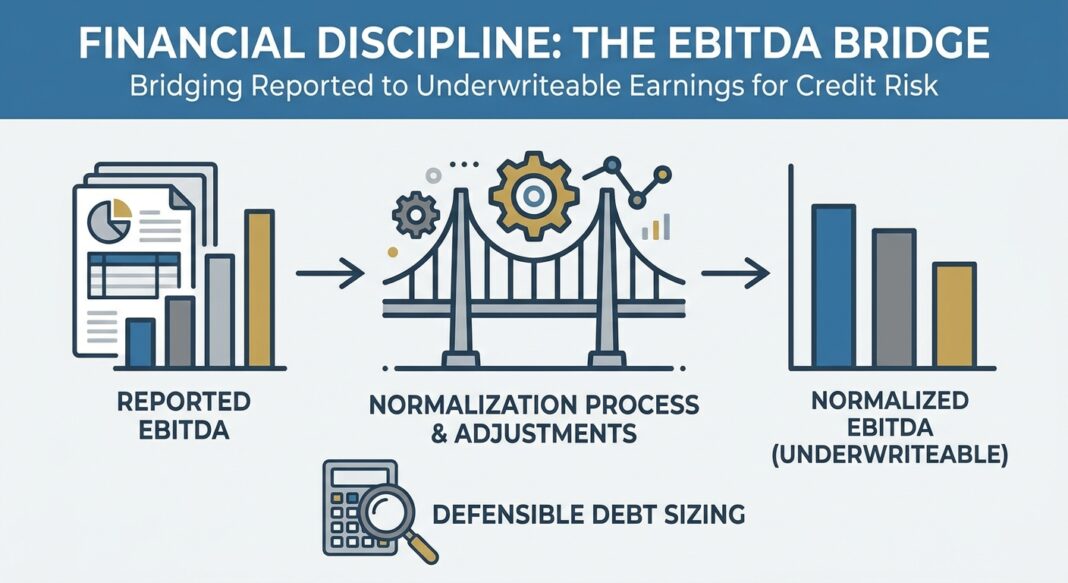
The normalization process follows a structured four-step bridge:
- Start with reported net income and add back Interest, Taxes, Depreciation, and Amortization (ITDA) to arrive at baseline EBITDA for the trailing twelve months (TTM).
- Apply upward adjustments for documented non-recurring or non-operational items: one-time transaction costs, non-recurring legal settlements, excess owner compensation above market replacement cost, related-party rent normalized to market, and owner perks run through the business.
- Apply downward adjustments for non-recurring revenue or one-time income items that inflated reported results, any pro-forma synergies without a track record, and costs that are recurring but were misclassified as one-time by the borrower.
- Arrive at Normalized EBITDA — the number the lender underwrites for leverage, coverage, and debt sizing calculations.
Example — $10M EBITDA Manufacturing Company:
| Line Item | Amount |
|---|---|
| Reported Net Income | $3,200,000 |
| + Interest Expense | $1,400,000 |
| + Taxes | $900,000 |
| + D&A | $2,500,000 |
| = Reported EBITDA | $8,000,000 |
| + M&A transaction costs (documented, non-recurring) | $600,000 |
| + Excess owner comp above market replacement | $350,000 |
| + Related-party rent normalized to market | $200,000 |
| − Recurring recruiting costs relabeled as one-time (rejected) | ($150,000) |
| = Lender-Normalized EBITDA | $9,000,000 |
Illustrative example for instructional purposes.
Notice that the borrower’s seller-presented adjusted EBITDA may have shown $10M. The lender’s independent normalization arrives at $9M — a $1M difference that, at a 5.0x leverage multiple, reduces supportable debt by $5M.
Walking the Numbers: Debt Sizing, Coverage, and Stress Testing
Once lender-normalized EBITDA is established, the underwriting team runs three core calculations:
1. Total Leverage Ratio (Debt / EBITDA)
Using the $9M normalized EBITDA from the example above and a proposed $40.5M total debt load:
Total Leverage = $40,500,000 / $9,000,000 = 4.5x
This is consistent with observed real-world benchmarks. According to Kayne Anderson BDC’s December 2025 10-K filing with the SEC, their private middle market loan portfolio carried a weighted average leverage ratio of 4.5x and a weighted average interest coverage ratio of 2.4x. These figures provide a calibration point for what institutional direct lenders are actually underwriting in today’s market.
2. Debt Service Coverage Ratio (DSCR)
DSCR measures how much normalized cash flow is available to cover all debt obligations (interest + scheduled principal amortization). The formula:
DSCR = Normalized EBITDA / Total Annual Debt Service
Assuming $40.5M total debt at a blended rate of 9.5% plus 5% annual amortization: annual debt service = approximately $5.9M interest + $2.0M amortization = $7.9M. DSCR = $9.0M / $7.9M = 1.14x — uncomfortably thin. Most institutional direct lenders target a minimum DSCR of 1.25x; many prefer 1.50x or higher at underwriting as a cushion for operating volatility. A DSCR below 1.20x at origination should trigger a structural review — either through reduced leverage, partial PIK interest, or an equity cure mechanism.
3. Stress Scenario Analysis
Underwriting must test the credit in a downside scenario, not just base case. A standard stress test applies a 15–20% EBITDA haircut to simulate a revenue contraction or margin compression event:
Stress EBITDA = $9.0M × 0.80 = $7.2M
Stress Leverage = $40.5M / $7.2M = 5.6x
Stress DSCR = $7.2M / $7.9M = 0.91x — debt service not covered
This stress output illustrates why entry leverage matters so acutely. A company that looks adequately covered at origination can quickly deteriorate into a workout situation if the normalized EBITDA was optimistically constructed or if operating conditions weaken modestly.
What Institutional Lenders Look For — And What They Reject
The Add-Back Acceptance Hierarchy
Not all add-backs carry equal weight in institutional underwriting. Experienced credit teams apply a tiered acceptance framework:
- Tier 1 — Full Credit (High Probability of Acceptance): Documented M&A transaction costs tied to the sale process; one-time legal costs where the underlying matter is confirmed resolved; D&A on intangible assets created in prior acquisitions.
- Tier 2 — Partial Credit (Requires Evidence): Excess owner compensation above market replacement cost — the add-back is only the delta above a third-party benchmarked salary; implemented price increases only if invoices and retention data confirm the increase is already in the run rate; related-party lease normalization supported by market rent comparables.
- Tier 3 — Rejected (High Scrutiny): Anticipated cost savings dependent on post-closing actions; pro-forma EBITDA from a planned acquisition without a track record; recurring expenses relabeled as one-time (if a "non-recurring" item appears across multiple periods, it is recurring by definition).
The 40% EBITDA Add-Back Cap
Some structured credit facilities are now contractually limiting total add-backs for smaller borrowers. Per a November 2025 SEC credit agreement filing, for obligors with EBITDA below $50 million, total discretionary add-backs were capped at 40% of non-adjusted EBITDA — a structural guardrail designed to prevent earnings inflation from driving unsustainable debt sizing.
📊 Credit Performance Data Box
- Private Credit Default Rate (Q1 2026): Proskauer’s Private Credit Default Index, tracking 697 loans totaling $189.2 billion, recorded a 2.73% default rate in Q1 2026 — up from 1.84% just two quarters earlier. (Source: Forbes/Proskauer, May 2026)
- Distressed Restructurings: Moody’s estimates that distressed restructurings accounted for roughly 65% of all 2025 private credit defaults, with selective defaults outpacing conventional defaults approximately 5:1 in 2024. (Source: Forbes, S&P Global, 2025–2026)
- Middle Market Leverage: Kayne Anderson BDC reported a weighted average leverage ratio of 4.5x and interest coverage of 2.4x across its private middle market loan book as of December 31, 2025. (Source: Kayne Anderson BDC 10-K, SEC, FY2025)
- KBRA At-Risk Portfolio: KBRA identified roughly 5% of 1,903 unique middle-market sponsor-backed borrowers as most at risk to default, citing prolonged base rates, fundamentally weak performance, and limited financial flexibility. (Source: KBRA Q4 2024 Surveillance Compendium, February 2025)
- Cliffwater CDLI Loss Rate: The Cliffwater Direct Lending Index (CDLI) produced an estimated annualized credit loss of 1.47% for its broader portfolio of middle market borrowers as of late 2025. (Source: Morgan Stanley / Cliffwater, 2025)
- Covenant-Lite Penetration: As of year-end 2024, 91% of outstanding U.S. leveraged loans were covenant-lite — roughly $1.29 trillion in face value — stripping away the early-warning detection mechanism that maintenance covenants traditionally provided. (Source: Resonanz Capital analysis, via AngelInvestorsNetwork, 2026)
Red Flags in the Earnings Bridge
- Widening Gap Between Reported and Adjusted EBITDA: A typical reported-to-adjusted gap runs 20–30% of EBITDA. Gaps materially wider signal aggressive normalization that will face Quality of Earnings (QoE) challenge.
- Recurring "Non-Recurring" Items: If a seller presents a given cost category as non-recurring across multiple fiscal years, lenders should treat it as a normalized operating expense. This is the most commonly rejected add-back category in QoE reviews.
- Gross Margin Volatility Without Explanation: If gross margin swings without a clear operational driver, diligence teams should assume misposted costs, missing accruals, or revenue recognition issues.
- Cash Flow Divergence: Buyers and lenders reconcile earnings to bank movements. Where reported profits do not convert to cash, the delta often reveals missing liabilities, related-party flows, or deferred expense recognition.
- Rising Payment-in-Kind (PIK) Income: At the portfolio level, rising PIK income is an early-warning signal of borrowers unable to service cash interest — a stress indicator that precedes formal default classification.
Underwriting Diligence Checklist: EBITDA Normalization
The following checklist reflects the diligence sequence institutional lenders use to independently validate normalized EBITDA before credit approval.
✅ Step 1 — Obtain and Map Source Financials
- Collect three years of audited (or reviewed) financial statements plus TTM management accounts
- Tie reported EBITDA to the general ledger — do not rely on management bridges without reconciliation
- Request detailed trial balances, not summary P&Ls
✅ Step 2 — Build an Independent Add-Back Schedule
- Require invoice-level support for every claimed non-recurring item
- Independently benchmark owner compensation against market replacement cost (use industry-specific salary surveys)
- Verify related-party lease economics against third-party market rent comparables
- Test whether any "one-time" item appears in more than one period — if so, reclassify as recurring
- Apply an EBITDA add-back cap if total adjustments exceed 30–40% of reported EBITDA
✅ Step 3 — Validate Revenue Quality
- Trace revenue to contracts, purchase orders, delivery evidence, and cash receipts
- Assess customer concentration (any single customer >15–20% of revenue warrants explicit covenant protection)
- Evaluate backlog, renewal rates, and pricing sustainability
- Test whether any recent revenue step-up is already embedded in the run rate or is pro-forma only
✅ Step 4 — Reconcile Earnings to Cash Flow
- Reconcile reported EBITDA to free cash flow, factoring in maintenance capex, changes in working capital, and cash taxes
- Stress-test DSCR at a 15–20% EBITDA haircut — target minimum of 1.20x DSCR in the downside scenario
- Review working capital seasonality and peak funding requirements
✅ Step 5 — Size Debt Against Normalized, Not Adjusted, EBITDA
- Set maximum leverage at Lender-Normalized EBITDA — never seller-adjusted EBITDA
- Document the earnings bridge in the credit memo with explicit add-back classifications (Tier 1 / Tier 2 / Rejected)
- Covenant leverage and coverage ratios to normalized EBITDA with the same definitional discipline
✅ Step 6 — Commission or Review Third-Party QoE
- For transactions above $5M in debt, require a buy-side or independently reviewed sell-side Quality of Earnings report from a nationally or regionally recognized accounting firm
- The QoE output should drive the lender’s accepted EBITDA — not the investment banker’s model
- Review the QoE for undisclosed liabilities: deferred revenue, customer deposits, sales tax exposure, family-member compensation, and customer concentration
Key Takeaways for the Underwriting Desk
- Normalize Independently, Not Deferentially: Seller-provided EBITDA bridges are a starting point, not a conclusion. Lenders who accept them at face value absorb the risk when adjustments fail to hold post-close.
- The EBITDA-to-Cash-Flow Gap is a Risk Signal: If normalized EBITDA does not translate into proportional free cash flow, identify the leak — maintenance capex, working capital consumption, or deferred liabilities — before sizing debt.
- Stress DSCR at Origination: A DSCR of 1.14x in base case leaves no room for operating deterioration. Middle-market direct lenders should target entry coverage that survives a 15–20% EBITDA stress with DSCR above 1.20x.
- Rising Defaults Reward Discipline: With private credit default rates climbing to 2.73% in Q1 2026 and Moody’s attributing roughly 65% of 2025 defaults to distressed restructurings, the spread between disciplined and undisciplined underwriters is widening. Normalized EBITDA rigor is a primary differentiator in recovery outcomes.
- Covenant-Lite is a Risk Amplifier: In a market where 91% of leveraged loans carry no maintenance covenants, lenders who include financial maintenance tests — specifically leverage and coverage covenants tied to independently normalized EBITDA — retain early-warning detection that cov-lite lenders have surrendered.


