
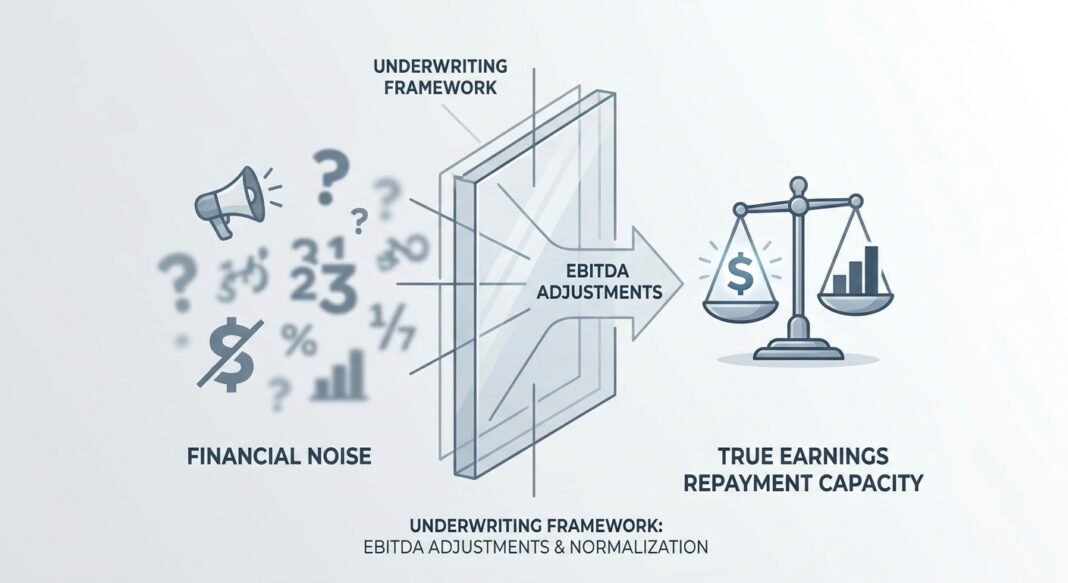
EBITDA Adjustments and Normalization: The Credit Underwriter’s Framework for Separating True Earnings from Financial Noise
When a borrower presents $10M in adjusted EBITDA, the real underwriting question isn’t whether the number is accurate — it’s whether it’s financeable.
The Underwriting Challenge
Imagine a middle-market manufacturing company seeking $42M in senior secured debt to finance a sponsor-led buyout. The Confidential Information Memorandum presents $10.2M in adjusted EBITDA — a compelling 4.1x leverage ratio on the surface. But the adjustments bridge is $3.8M wide. It includes $1.1M in “one-time” litigation costs that have recurred for three consecutive years, $900K in above-market owner compensation normalization, $600K in a related-party lease reset, and $1.2M in projected cost synergies that have no execution history.
This is where credit underwriting either earns its keep or fails the portfolio.
EBITDA normalization sits at the center of every leveraged credit decision. It determines debt sizing, covenant headroom, interest coverage capacity, and ultimately the probability of repayment. Yet it is also the single most contested number in any transaction, with sellers systematically incentivized to present the highest defensible figure while lenders must underwrite to the most sustainable one.
As one advisory framework puts it, auxocapitaladvisors.com: the practical issue is not whether a seller can identify possible adjustments — it is whether buyers, lenders, quality of earnings providers, and investment committees will accept those adjustments as recurring economic value. This distinction is the foundation of rigorous credit underwriting.
The Analytical Framework: From Reported EBITDA to Lender-Accepted EBITDA
A disciplined credit underwriter moves through a structured sequence before accepting any EBITDA figure as the basis for debt sizing or covenant setting. The journey runs from reported EBITDA → normalized EBITDA → lender-accepted adjusted EBITDA — and each step applies a tighter filter.
Step 1: Anchor to Reported Financials
Always begin with audited or CPA-reviewed trailing twelve-month (LTM) financials. Internally prepared or management-adjusted statements are starting points only. The LTM figure itself requires care: stub-period EBITDA calculations must use identical accounting bases across both periods, identical depreciation treatment, and the same stock-based compensation policy to avoid construction errors.
Step 2: Define Normalized EBITDA
Normalized EBITDA is a buyer-underwritable estimate of sustainable, recurring operating earnings. It starts with reported EBITDA, removes non-recurring, non-operating, and owner-specific items, and adjusts for supportable run-rate effects that a lender can reasonably rely on, per auxocapitaladvisors.com. Critically, this differs from adjusted EBITDA because buyer-accepted normalization requires stronger evidence, cleaner definitions, and consistency with the full diligence record.
Step 3: Apply a Lender’s Conservative Filter
Lenders are structurally more conservative than equity buyers. They use the most conservative EBITDA definition because it drives debt sizing, covenants, and repayment capacity, per msllc.com. In practice, this means banks and private credit funds will only count adjustments that can be clearly traced back to the company’s financial statements and are defensible as genuinely non-recurring.
Step 4: Run a Quality of Earnings Review
A Quality of Earnings (QoE) analysis is the diligence process that tests the earnings bridge. A QoE review typically evaluates revenue recognition, customer concentration, revenue quality, gross margin trends, add-back support, reserves, accounting cutoffs, working-capital behavior, cash conversion, and the relationship between EBITDA and free cash flow, according to auxocapitaladvisors.com. The purpose is not arithmetic verification — it is to determine whether the earnings base is accurate, repeatable, and financeable.
📌 The Six Categories of EBITDA Adjustments (Lender Perspective)
| Category | Example | Lender Acceptance |
|---|---|---|
| Owner Compensation Normalization | Excess salary vs. market-rate CEO replacement | ✅ Generally accepted with documentation |
| One-Time / Non-Recurring Costs | Settled litigation, restructuring severance | ✅ Accepted if truly non-recurring — requires 3-year history |
| Related-Party Adjustments | Below-market rent from owner-held real estate | ✅ Accepted when reset to third-party market rate |
| Non-Cash Charges | Stock-based compensation, non-cash impairments | ⚡ Conditional — stock comp often excluded by lenders |
| Pro Forma / Run-Rate Synergies | Projected savings from a plant closure | ❌ Heavily scrutinized — requires demonstrated execution history |
| Add-Downs (Negative Adjustments) | Under-market owner salary requiring market replacement | 🚨 Often overlooked by sellers; lenders apply independently |
Source: Bond Capital synthesis of institutional underwriting standards. See windsordrake.com, auxocapitaladvisors.com.
Walking Through the Numbers: A $10M EBITDA Manufacturing Example
Using our hypothetical manufacturing borrower, here is how a credit committee actually works through the bridge:
📊 EBITDA Normalization Walkthrough — $42M Senior Secured Transaction
| Line Item | Amount | Underwriter’s Assessment |
|---|---|---|
| Reported LTM EBITDA | $6.4M | Audited — anchor figure |
| + Owner Compensation Add-Back | +$900K | ✅ Accepted: salary $650K above $400K market rate, documented via 3 years of W-2s |
| + Related-Party Lease Normalization | +$600K | ✅ Accepted: independent appraisal confirms $600K below-market delta |
| + Litigation Settlement (FY2025) | +$1.1M | ❌ Rejected: identical charge appears in FY2024 and FY2023 — pattern indicates recurring operational risk |
| + Projected Cost Synergies | +$1.2M | ❌ Rejected: management has no prior execution record; add-back belongs in upside model, not base case |
| – Add-Down: Missing Head of Sales | -$300K | 🚨 Applied by lender: departing VP of Sales requires market-rate replacement |
| Lender-Accepted Normalized EBITDA | $7.6M | vs. seller’s $10.2M — a 25% reduction |
At $42M debt against $7.6M normalized EBITDA, the lender-calculated leverage is 5.5x — not 4.1x as presented. This changes the risk profile, covenant structure, and potential pricing materially.
Stress-Testing the Coverage Ratio
Once normalized EBITDA is established, the underwriter stress-tests repayment capacity. At $42M in senior debt carrying a floating rate of SOFR + 450 bps (approximately 9.0% all-in as of mid-2026), annual cash interest is approximately $3.8M. Against $7.6M in normalized EBITDA, the interest coverage ratio is 2.0x at the base case — and collapses to 1.3x under a 25% EBITDA stress scenario. That is insufficient headroom for most institutional lenders. The average EBITDA-to-interest coverage ratio in leveraged deals declined to approximately 3.1x in 2024, down from over 4.0x during 2019–2022, per privatecapitalgllobal.com, meaning thin coverage is already a systemic vulnerability — not just a deal-specific concern.
The stress test also informs covenant setting. If normalized EBITDA is $7.6M at close, a leverage covenant set at 6.0x Total Debt/EBITDA offers almost no cushion against EBITDA erosion before a breach is triggered.
What Institutional Lenders Require: Standards, Data, and Red Flags
The Leverage Threshold Framework
The historical benchmark for institutional lenders has been the 6x Total Debt/EBITDA threshold. The Interagency Guidance on Leveraged Lending, issued by the Federal Reserve, OCC, and FDIC, explicitly states that a leverage level in excess of 6x Total Debt/EBITDA raises concerns for most industries, per federalreserve.gov. While the OCC and FDIC rescinded the formal guidance in late 2025, the 6x threshold remains deeply embedded in institutional credit practice and risk committee frameworks. Market data confirms that most current transactions clear around 5.0x EBITDA leverage, per privatecapitalglobal.com.
For repayment capacity, the supervisory standard — still considered best practice — is that borrowers should demonstrate the ability to fully amortize senior secured debt or repay at least 50% of total debt over a five-to-seven year period, per sullcrom.com. When projected de-levering depends entirely on refinancing rather than cash generation, adverse risk ratings typically follow.
EBITDA Add-Backs: The Persistent Accuracy Problem
Institutional underwriters are right to be skeptical of large adjustment bridges. An EBITDA add-back that is rejected at a 6x multiple costs $600K in enterprise value for every $100K of disallowed adjustment, as windsordrake.com illustrates. Sellers who treat adjusted EBITDA as a marketing exercise rather than an underwriting exercise consistently lose credibility and leverage during diligence. Furthermore, pkfod.com notes that buyers increasingly want direct linkage from EBITDA to sustainable free cash flow — not just a cleaned-up income statement number.
📊 Credit Performance Data Box
- Leveraged Loan Default Rates: The trailing 12-month leveraged loan default rate projected to reach 7.9% in Q1 2026 before easing to 7.3% in Q2 2026, per moodys.com — nearly double the 3.4% historical average. Overstated EBITDA at origination is a primary driver of deteriorating coverage and eventual default.
- First-Lien Recovery Rates: First-lien senior secured loans have historically recovered roughly 70–80 cents on the dollar, per collateralizedloanobligations.com. Expected recoveries have drifted lower toward 60–70%, driven by loan-only capital structures and covenant-lite documentation. Second-lien historical mean recovery is 42 cents on the dollar, per S&P Global data cited by lsta.org.
- Speculative-Grade Default Trajectory: Moody’s projects speculative-grade defaults declining to 3.0% in the US by October 2026, down from 5.3% in October 2025, per moodys.com. However, the same report flags hidden leverage, weaker documentation, and intensifying deal competition as key risk factors that could disrupt base-case projections.
- Covenant Breach Rates: PE-backed firms carry approximately 4–5% higher covenant violation rates than non-PE firms, tied directly to higher total leverage ratios at close, per Federal Reserve research cited at federalreserve.gov. This underscores the direct connection between aggressive EBITDA normalization and downstream covenant stress.
- Middle-Market Leverage Discipline: Lower mid-market transactions generally carry 3.5x–4.5x leverage, while upper mid-market deals range from 5.0x–5.5x, per privatecapitalglobal.com. Transactions in cyclical or volatile sectors face even more conservative structures.
Red Flags That Demand Immediate Scrutiny
- 🚨 Recurring “One-Time” Charges: Any expense labeled non-recurring that appears in two or more of the last three fiscal years should be treated as a structural cost of the business.
- 🚨 EBITDA-to-Cash Flow Disconnect: If EBITDA is rising but operating cash flow is flat or declining, the improvement is likely accounting-driven rather than operational. Reconcile every time.
- 🚨 Large Pro Forma Synergies Without Execution History: Forward-looking cost savings without a demonstrated track record belong in the upside scenario — never in base-case underwriting.
- 🚨 Missing Add-Downs: A credible EBITDA schedule includes both addbacks and add-downs. Sellers focused only on additions are presenting a marketing document, not an underwriting document.
- 🚨 Unrestricted Subsidiary Structures: Credit agreements that permit designation of unrestricted subsidiaries can exclude significant operating assets from covenant calculations, artificially improving reported compliance metrics, per sidley.com.
- 🚨 Payment-in-Kind (PIK) Feature Prevalence: A growing use of PIK interest toggles signals that borrowers cannot service cash interest — a leading indicator of future distress even when reported EBITDA appears adequate.
The Bond Capital EBITDA Normalization Underwriting Checklist
Use this framework on every leveraged credit transaction before presenting to investment committee:
✅ Phase 1 — Document Collection
- Three years of audited (or CPA-reviewed) financial statements plus interim period
- Management-prepared EBITDA bridge with line-item documentation for every adjustment
- Independent Quality of Earnings report from a reputable third-party advisor
- Bank statements and tax returns for the last 3 fiscal years (reconcile to financials)
- All related-party agreements: leases, management fees, intercompany loans
✅ Phase 2 — Build the Lender’s Own Bridge
- Construct LTM EBITDA independently — do not adopt seller’s LTM calculation without verification
- Review each add-back against a three-year history: has this charge appeared before?
- Apply add-downs independently: assess replacement cost of departing key personnel, market-rate leases, and missing infrastructure
- Reconcile normalized EBITDA to operating cash flow — require explanation of any divergence exceeding 15%
- Stress-test: model a 20–30% EBITDA decline and calculate coverage and leverage under that scenario
✅ Phase 3 — Stress Test & Covenant Design
- Set covenant leverage trigger with minimum 15–20% cushion to closing leverage — never covenant-tight at close
- Confirm compliance certificate delivery timeline: maintenance covenants are typically tested quarterly, with compliance certificates delivered 45–60 days after quarter-end, per sidley.com
- Run at least one downside scenario through covenant compliance — document the breach point
- Confirm de-leveraging path: can the borrower repay 50%+ of total debt within 5–7 years from operating cash flow alone?
- Require quarterly financial reporting, including variance-from-plan analysis from inception of the credit
✅ Phase 4 — Investment Committee Questions
- What is the delta between the seller’s adjusted EBITDA and the lender’s accepted figure — and why?
- What percentage of normalized EBITDA derives from adjustments vs. reported earnings? Anything above 30% warrants additional scrutiny.
- How does the coverage ratio perform under a 1-turn EBITDA compression? Under 2 turns?
- What is the first-lien recovery assumption in a stress scenario, and what is the expected loss rate at current leverage?
Key Takeaways
- 🔍 The EBITDA Number That Matters Is the One You Build Yourself. Seller-provided schedules are a starting point, never a conclusion. Lenders independently evaluate normalized EBITDA during underwriting, and add-backs that cannot be clearly traced to financial statements are routinely removed, per pioneercapitaladvisory.com.
- 🔍 Add-Downs Are as Important as Add-Backs. Normalized EBITDA can be lower than adjusted EBITDA when the business requires additional costs under new ownership — understaffed finance teams, below-market owner salaries, or deferred capex all reduce sustainable earnings. A credible underwriting schedule includes both directions, per windsordrake.com.
- 🔍 EBITDA Alone Is Not a Repayment Analysis. The persistent problem with leverage-only underwriting is that EBITDA does not capture cash interest, working capital requirements, maintenance capex, or refinancing risk. Always reconcile normalized EBITDA to free cash flow and model full debt service coverage, not just leverage ratio.
- 🔍 The 6x Leverage Threshold Remains a Practical Risk Sentinel. While the formal regulatory guidance was rescinded by the OCC and FDIC in 2025, the 6x Total Debt/EBITDA threshold endures as an industry standard because it reflects genuine credit risk inflection — above that level, the ability to de-lever from operating cash flow becomes structurally impaired for most business models.
- 🔍 Covenant Design Must Be Calibrated to Lender-Accepted EBITDA, Not Seller EBITDA. A leverage covenant built on an overstated EBITDA figure provides false protection — the borrower looks compliant on paper while the economic reality deteriorates. Covenant-lite structures and weak documentation are explicitly identified by Moody’s as factors increasing leverage, valuation, and transparency risks in the current market, per moodys.com.


